The IOM 2016 Census was published on 9 March 2017. This is the first of a series of blogs covering some of the main issues raised by the census.
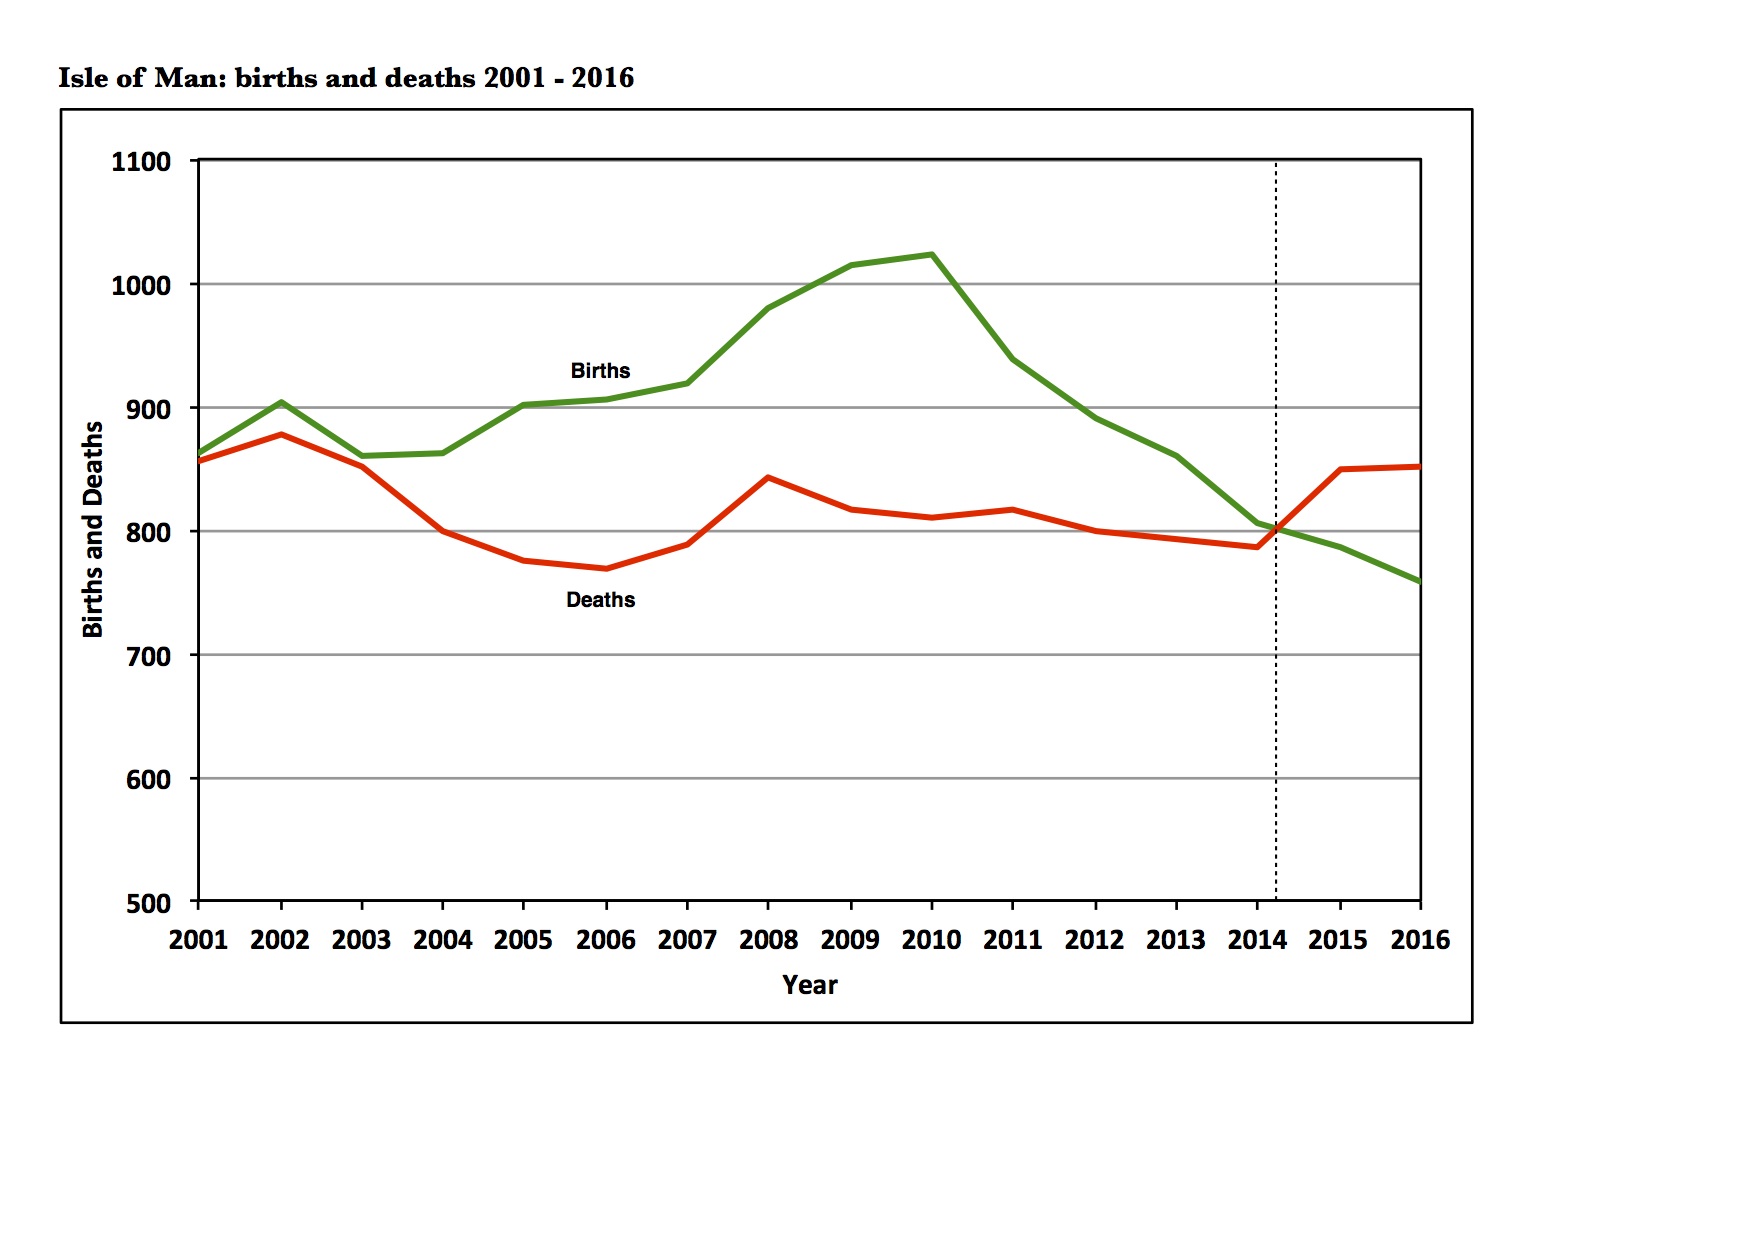
Statistics for births in the Isle of Man are published annually. The recent decline in the number of births was introduced in the Population Atlas and has been the focus of some of the previous blogs on this website. In summary, after 2001 births increased fairly steadily reaching a peak of 1,023 in 2010. In the last six years there has been a very marked and sustained fall in the number of births. The number of births in 2016 stood at 758, the lowest for 30 years and 26% lower than in 2010. By 2015 there were fewer births than the number of deaths and this negative natural population balance continued into 2016 when deaths exceeded births by 94. The first graph below shows the sharpness of the decline in births from 2010 onwards.
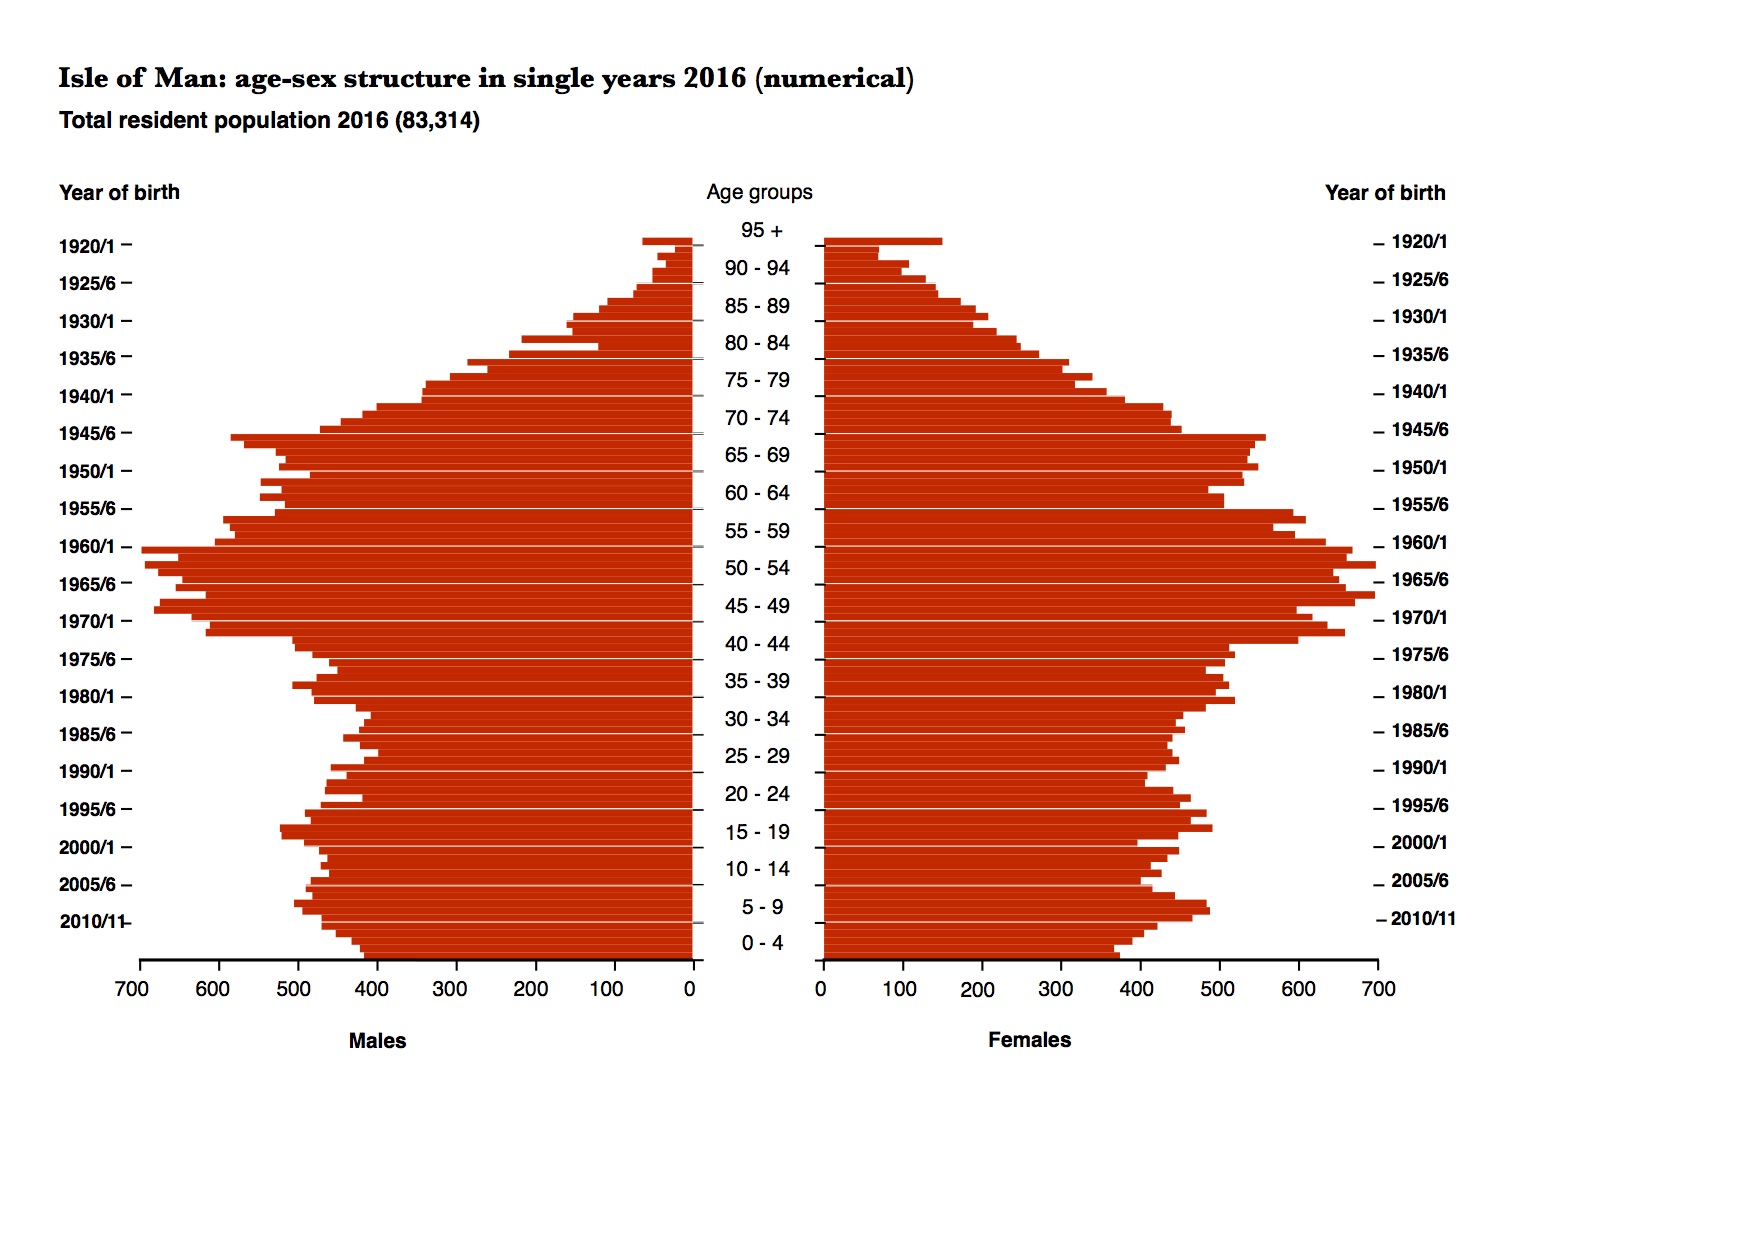
It is inevitable that a decline in the number of births on this scale is visible in the Island's age-sex structure. The graph below shows ages in single years taken from the 2016 Census (Table 2.5). The base of the graph shows a pronounced narrowing from the age of 7 or 8 downwards. On each side of the graph the number of males and females at ages 7 or 8 years approaches 500. At the very base of the graph the under 1 year old males and females number only 400. This fall in the number of births will remain a feature of the Island's age-sex structure for the next seventy years or more. Just as the post-war baby boom is still clearly visible as a bulge on the graph in the 65-69 years age group, so the lower number of births over the last few years will show as hollows passing up through both sides of the pyramid. Migration may help to reduce the effects but it is unlikely ever to conceal the years with births of below 800.
The drop in births perhaps already accounts for the closure of a multiple baby retail outlet. In years to come it will bring other impacts. There will be fewer sixth formers in the early 2030s and fewer university graduates later that decade. It is worth noting that the census data below relates to April 2016. Since then the published data for the whole of 2016 shows a further reduction in births.
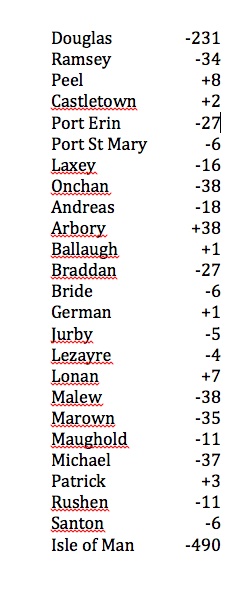
The proportional squares map below shows the percentage change in the size of the 0-4 years population of the Island's twenty-four census districts between 2011 and 2016. The numerical changes are show in the table below the map. Overall, the number of children aged 0-4 years has fallen by 490 or 10.6% but this loss is very unevenly spread. Arbory, going against the trend, shows a remarkable increase and another half dozen local authorities show slight increases. Some of the other areas show very pronounced losses. Bride has the biggest percentage loss of over 46% but this only represents a small number of children in the least populous parish.
The most noticeable drops in the 0-4 years population are seen in Malew, Marown and Michael which each experienced losses of more than 30 children amounting to around 30% of the totals 5 years earlier. It is not difficult to see that successive school intakes will be affected by reductions in births such as these.
Migration might help to reduce some of the impact of the reduction in births. One unexpected feature of the 2016 Census was that as the 0-4 population of 2011 became the 5-9 population of 2016 it grew by almost 100 (2.1%) due to net immigration. This was the only age group to experience net gain through migration. It is apparent, however, that net migration gain of 100 cannot wipe of the impact of 490 fewer births.
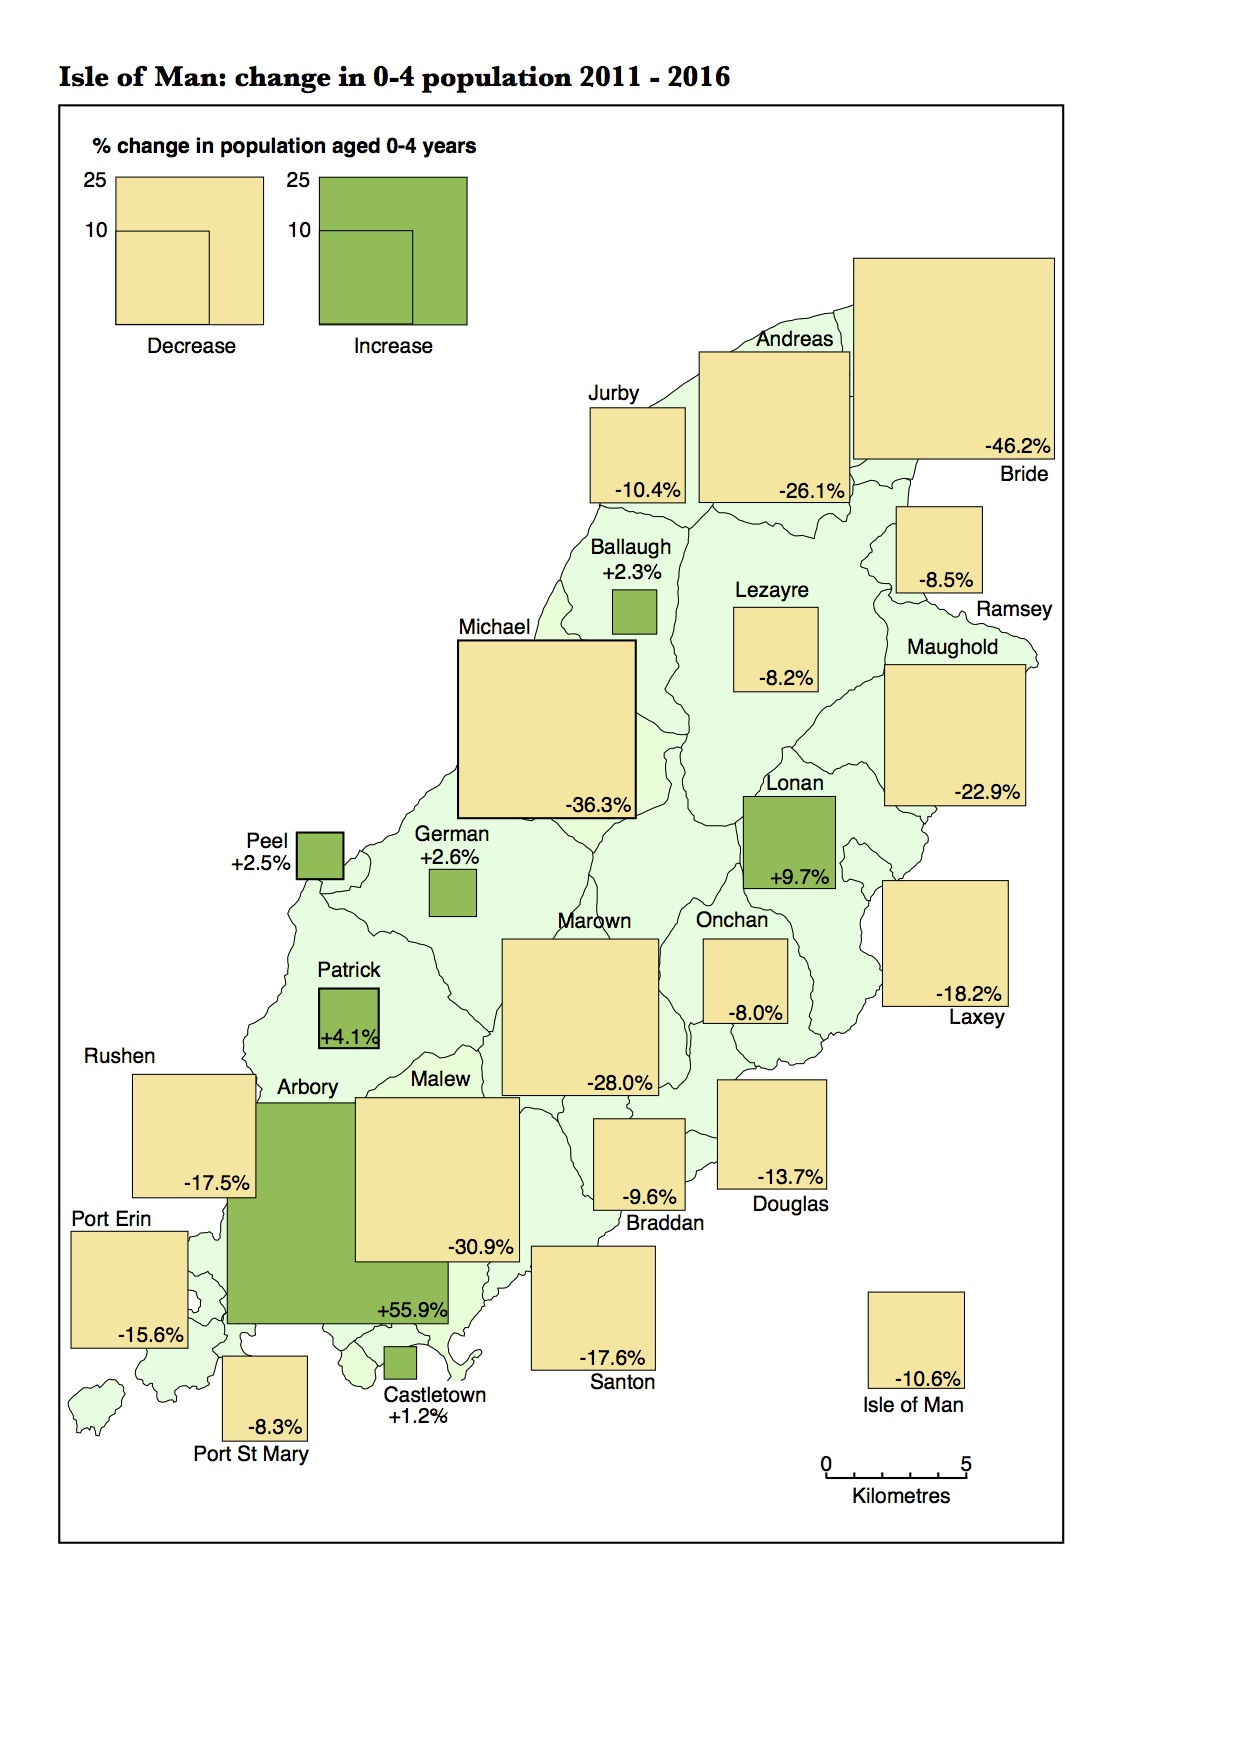
Isle of Man: changes in the number of 0-4 year olds between 2011 and 2016