The graphs and commentary below provide an update on what has happened to the population of the Isle of Man since the 2016 Census.
It is three years since the 2016 Census recorded that three decades of continuous population growth had come to an end. The Island’s population had fallen by almost 1,200 between 2011 and 2016 dropping to a new total of 83,314.
Earlier blogs on this site have documented the rises in the median age and the population aged over 65 years and outlined the vulnerability of the Isle of Man’s population, but what has been happening to the population since the 2016 Census?
The Quarterly Economic Reports to the Council of Ministers provide estimates that suggest the population has been rising since the census, but only slowly.
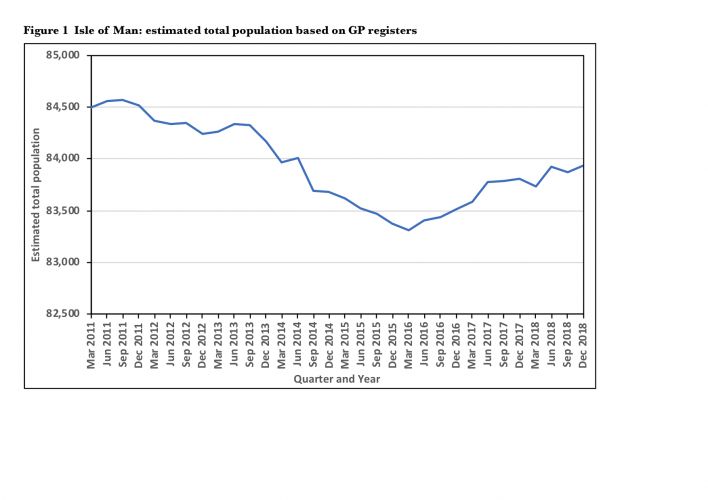
Figure 1 uses data supplied by the Economic Affairs division of the Cabinet Office. These data are used in the COMIN reports where they are presented, unhelpfully I feel, in the form of estimated population change since the same quarter in the previous year. The source of the estimates are the GPs’ patient registers. These invariably over-count the resident population as there are time-lags involved so a function (referred to as a ‘ghost factor’) is applied to bring the GP register numbers in line with the fixed points of the census counts.
Figure 1 shows that since the census the estimated population increased by 618 up to 83,932 by December 2018. This gave an average growth of 225 per year, or less than 0.3% per year. The population appears to be growing at a rate similar to the average decline between 2011 and 2016. At this rate of growth, the population would be restored to a level approaching its 2011 total by 2021. Clearly this rate of growth is a very long way from the projections used in numerous planning documents and makes the Strategic Plan’s projected population of 93,000 by 2026 no longer relevant.
Key issues here involve the need to develop improved monitoring using multiple sources (as in Jersey) and the need for co-ordinated research to help us better understand the causes of the decline prior to 2016, the slow growth since and the effectiveness of the measures being taken or considered.
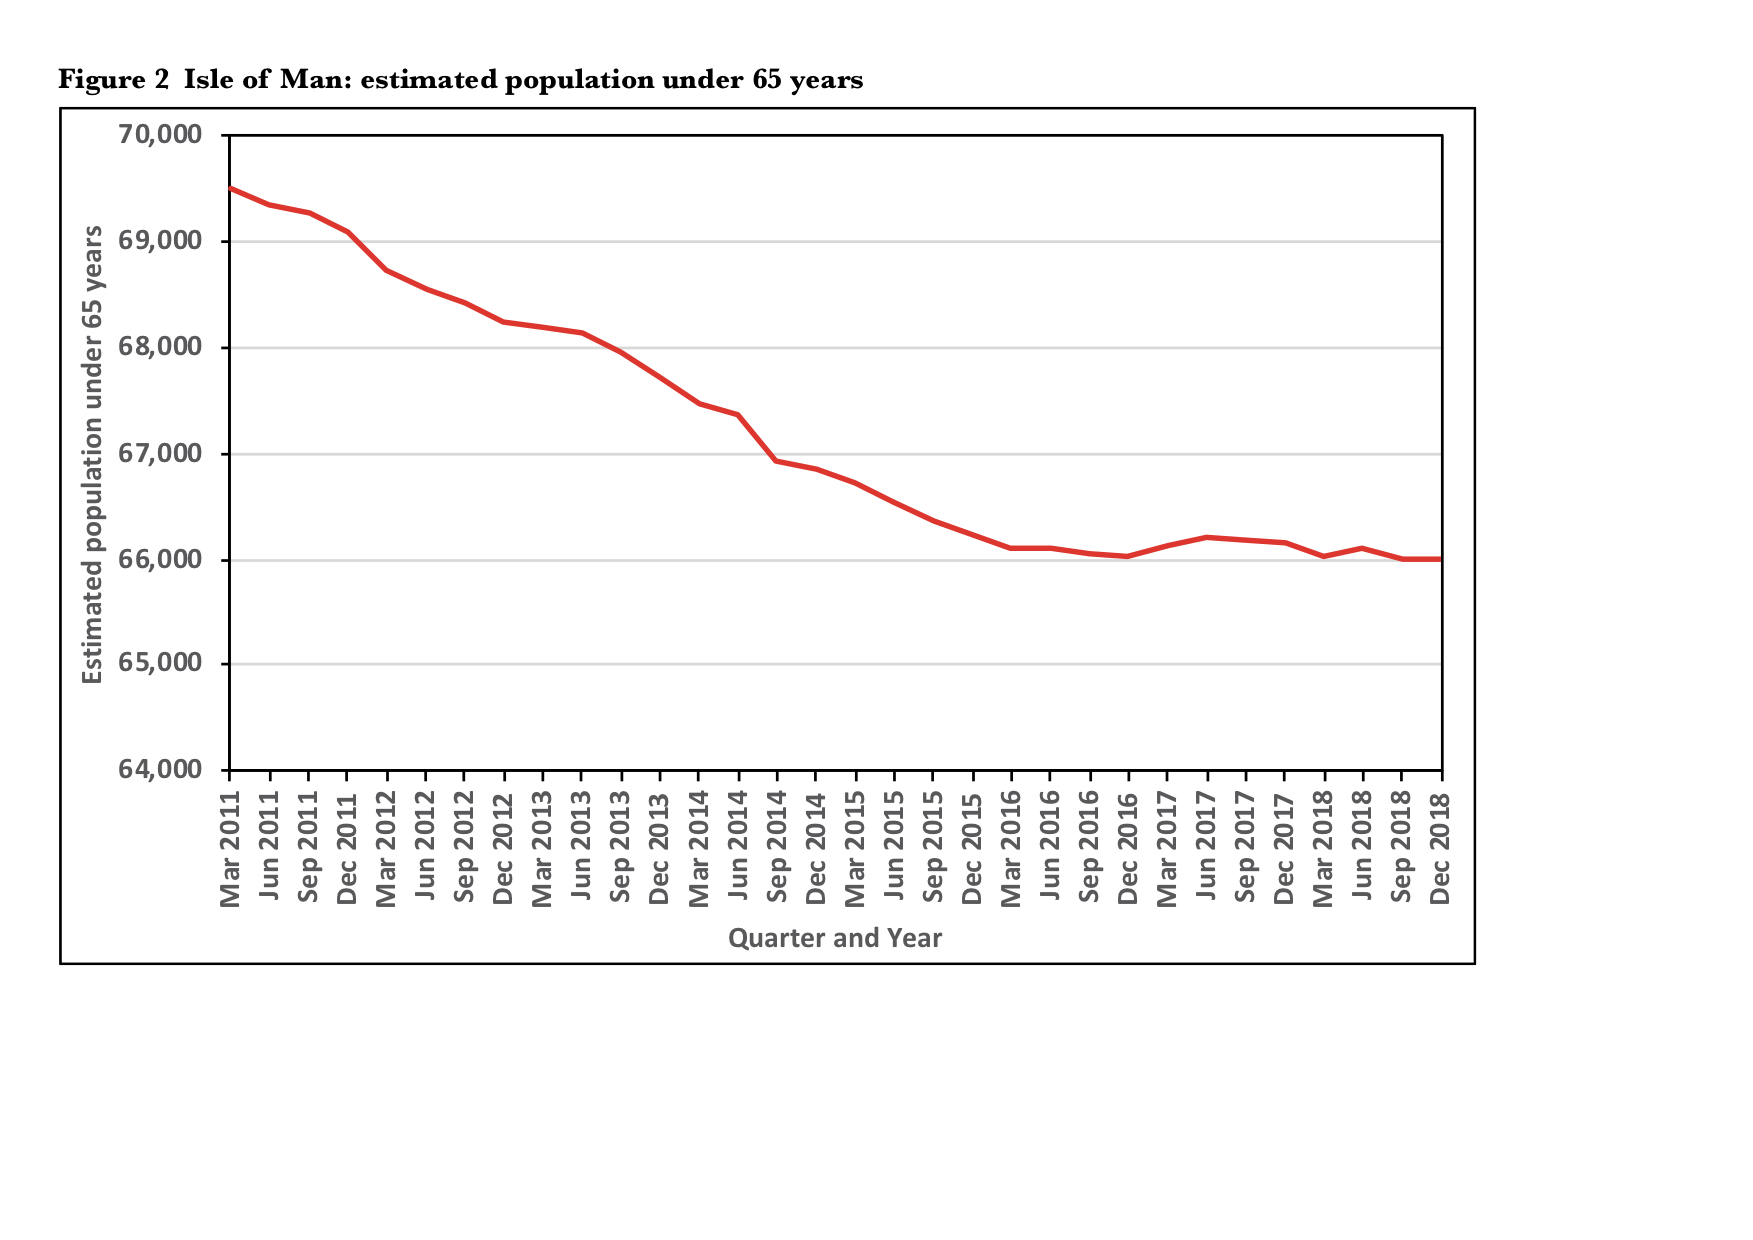
Figure 2 uses data from the same source. Doctors’ registers record not only the total number of patients but also the split between those people under and over the age of 65 years. This graph paints a very different picture from Figure1. The size of the population aged under 65 has not increased at all since the census. At the end of 2018 there were 117 fewer residents aged under 65. This might suggest that attempts to increase the working-age population have had limited success so far. The decline in the under 65 population between 2011 and 2016 has been halted but the Island remains vulnerable. The Isle of Man has one of the lowest levels of unemployment in Europe. In the last quarter of 2018 there were fewer than 400 unemployed people and more than 2,000 full and part-time vacancies, but this has not been sufficient to make the Island as attractive to young workers as it was ten years ago.
Nothing attracts young adults and families more than vibrant and developing social and economic scenes for these groups. Young adults are in short supply throughout the developed world: countries are quietly competing for them, hence free, or low cost, university education in Denmark, Finland, Iceland, Norway, Sweden and Japan. A decline in the number of young adults can become cumulative.
The encouraging evidence in COMIN reports of growth in the number of people in employment in part simply reflects the rising state pension age for women bringing with it the need to work for longer.
It is worth noting that in 2018 deaths exceeded births by 196 nevertheless the overall population grew by 199. There was clearly net migration gain of almost 400 but this was still insufficient to bolster the under 65 population.
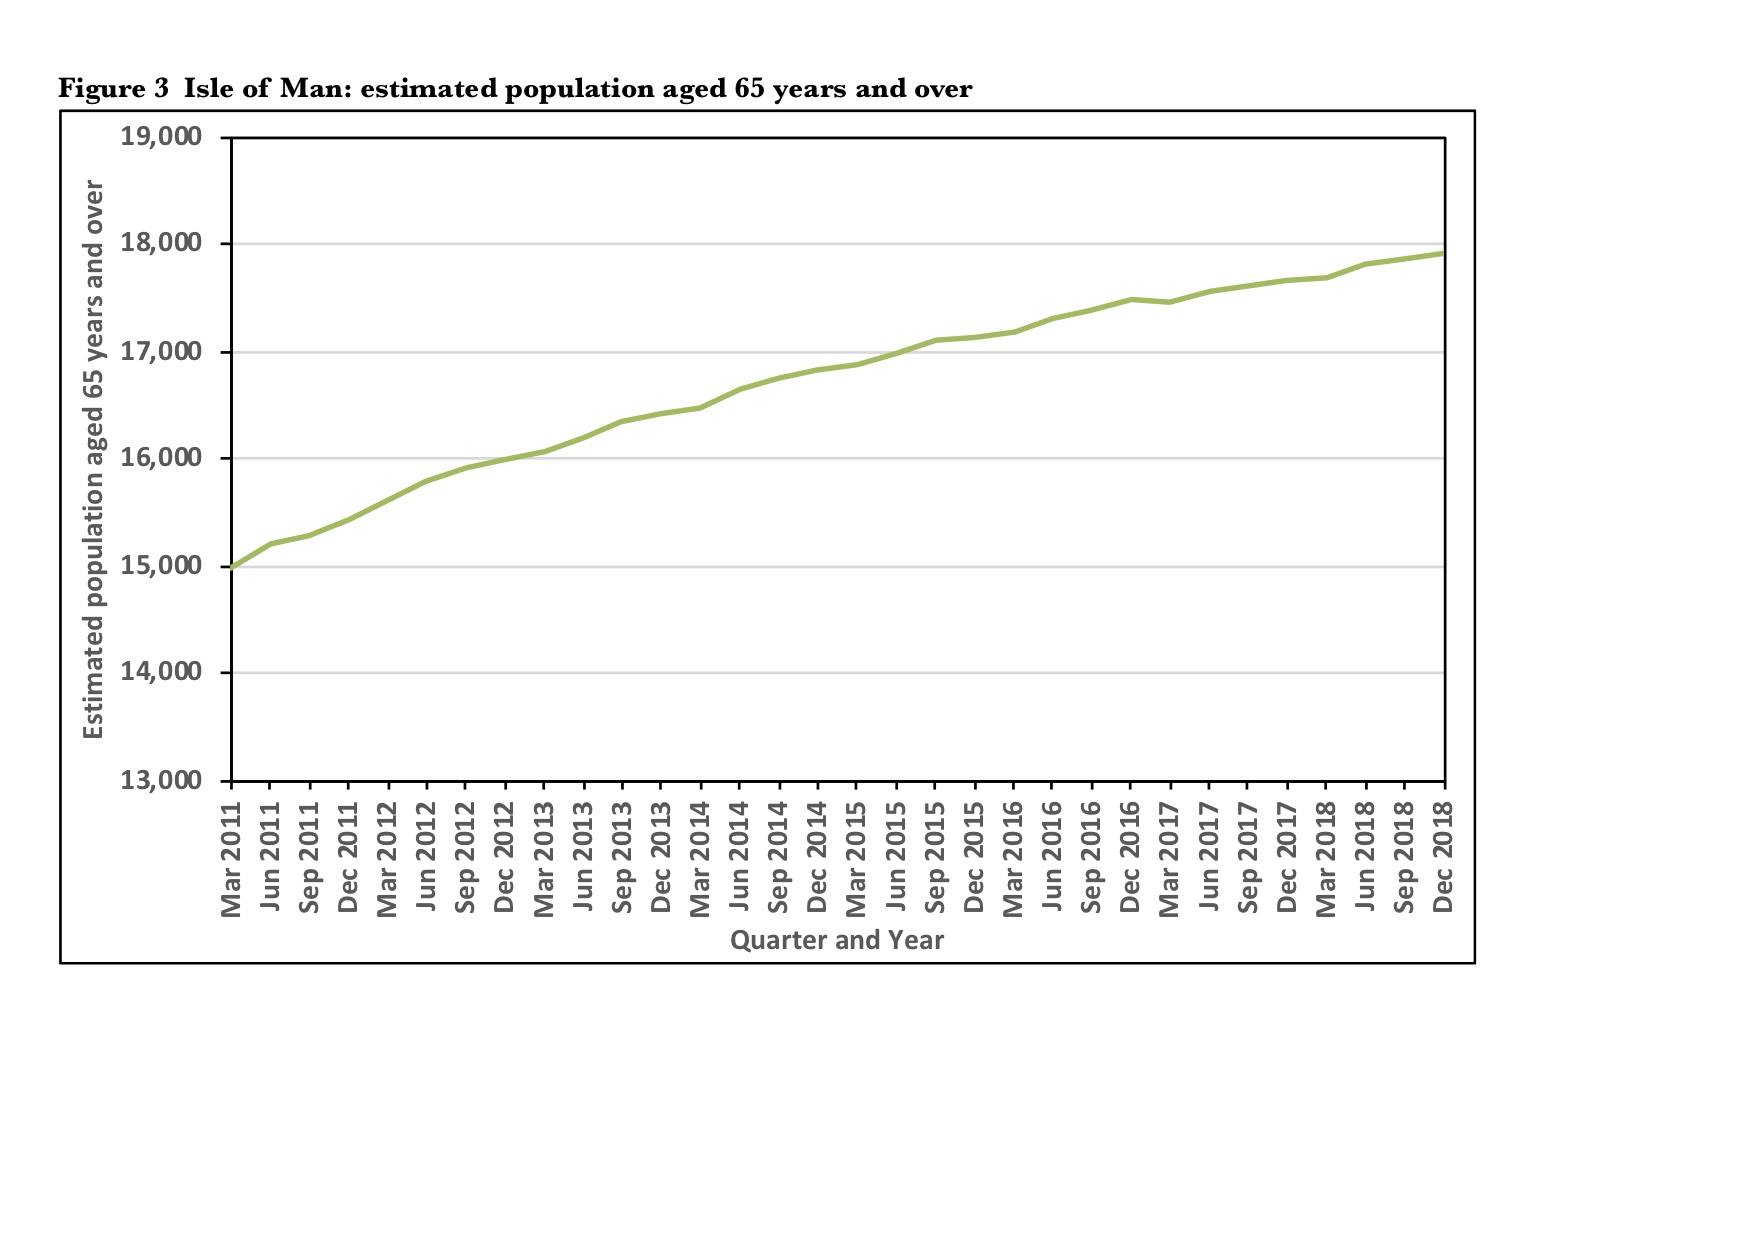
Figure 3 shows the estimated population aged over 65 years. This is the figure that, in 2013, prompted the Chief Minister of the time, to suggest that the: ‘biggest threat to the social and economic future of the Isle of Man… (is) the demographic reality that our nation is growing older.’ Since the 2016 Census, the number of people aged 65 plus is estimated to have increased by a further 735 (an average of 267.3 per year). The proportion of the population aged over 65 years rose from 20.6% in March 2016 to 21.4% in December 2018. The government figures show that the over 65 age group crossed the 21% mark in September 2017, making the Island’s population ‘hyper-aged’ according to a UN definition. Using this measure, the Isle of Man is one of the six oldest countries in the world alongside Japan, Italy, Portugal, Germany and Finland.
This growth in the over 65s is not the results of migration gains in this age group. Increasing longevity may contribute to the numbers but the biggest driver is the age-structure of the Island’s population which leaves us very exposed to future population ageing. There are over 1,000 people in every age group over 60 (i.e. aged 61, 62, 63 etc.), which means that more than 1,000 people cross the threshold of 65 every year adding to the over 65 age group. Because there are so many people aged in their 50s and early 60s they add to the over 65 groups as each year passes. The existing population structure means that this will continue to happen for many years to come.
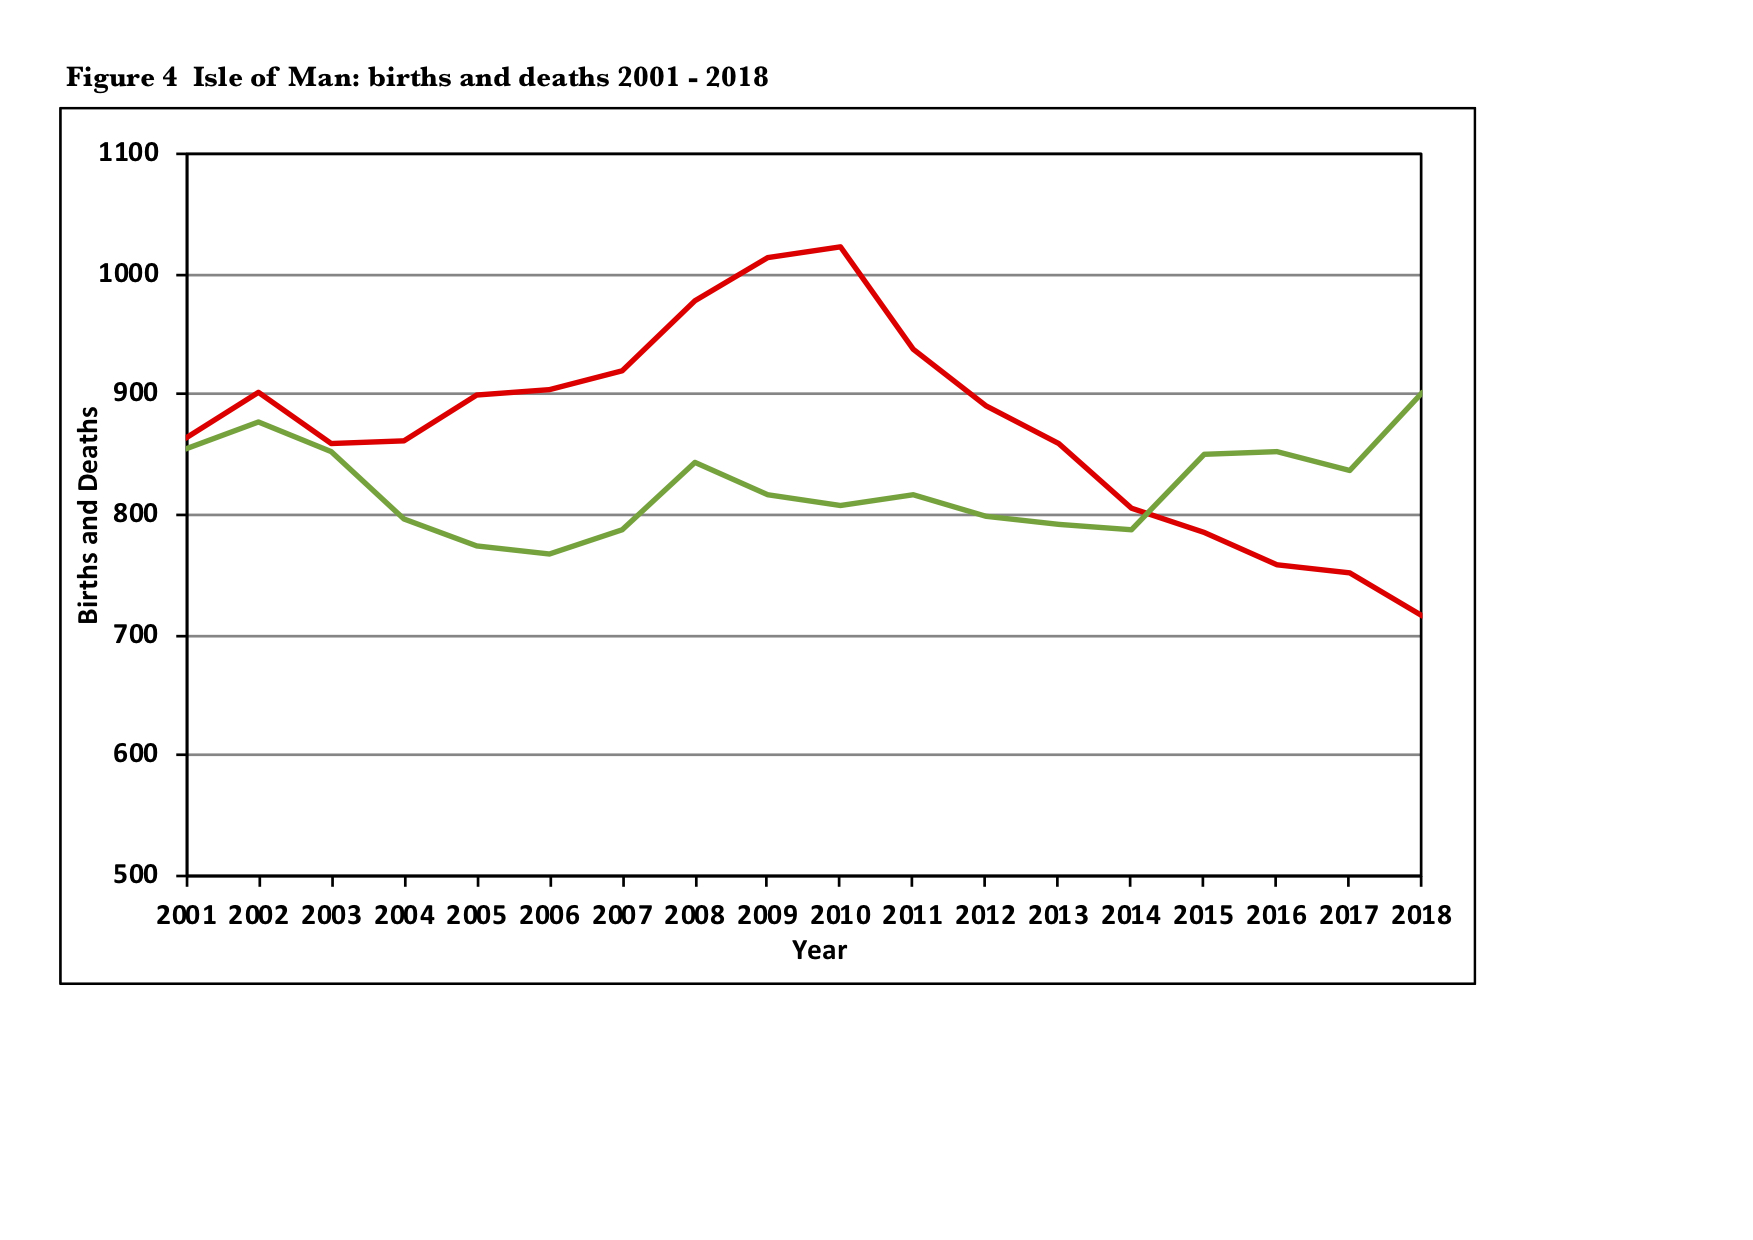
The next graph shows the actual number of births (in red) and deaths (in green) registered each year. After a period of very high births in 2009 and 2010, when over 1,000 babies were born in each year, the number of births had declined to under 800 by 2015, with deaths outnumbering births for the first time this century. This reflected, on the one hand, the net emigration of younger adults, delayed first pregnancy and larger gaps between pregnancies and, on the other hand, the growing elderly population.
Since the 2016 Census the number of births have continued to decline, falling from 785 in 2015 to 717 in 2018 (the lowest number of births since 1986 when the Island’s population was just 66,000). By the end of 2018, births were almost 30% lower than in 2010. It is to be anticipated that this substantial and sustained drop in births will still be visible on the Island’s age-sex structure pyramids in 60 or 70 years time.
The Isle of Man is not alone in seeing declining births. France is recognised as a country with policies to combat falling births: incentives of nearly £700 per month for one year after the birth of a third child, less tax to pay for families with more children, three years paid parental leave, subsidised daycare for under 3s and full time school places from 3 years upwards.
In the Isle of Man the low and declining number of births appears to be the result of both changing fertility patterns and the net emigration of young adults. Moves to further increase the pre-school credit (it was doubled in the 2019 budget) and to offer tax holidays for returning university students and others have a great deal to offer but the scale of this issue warrants detailed research into the causes and possible interventions.
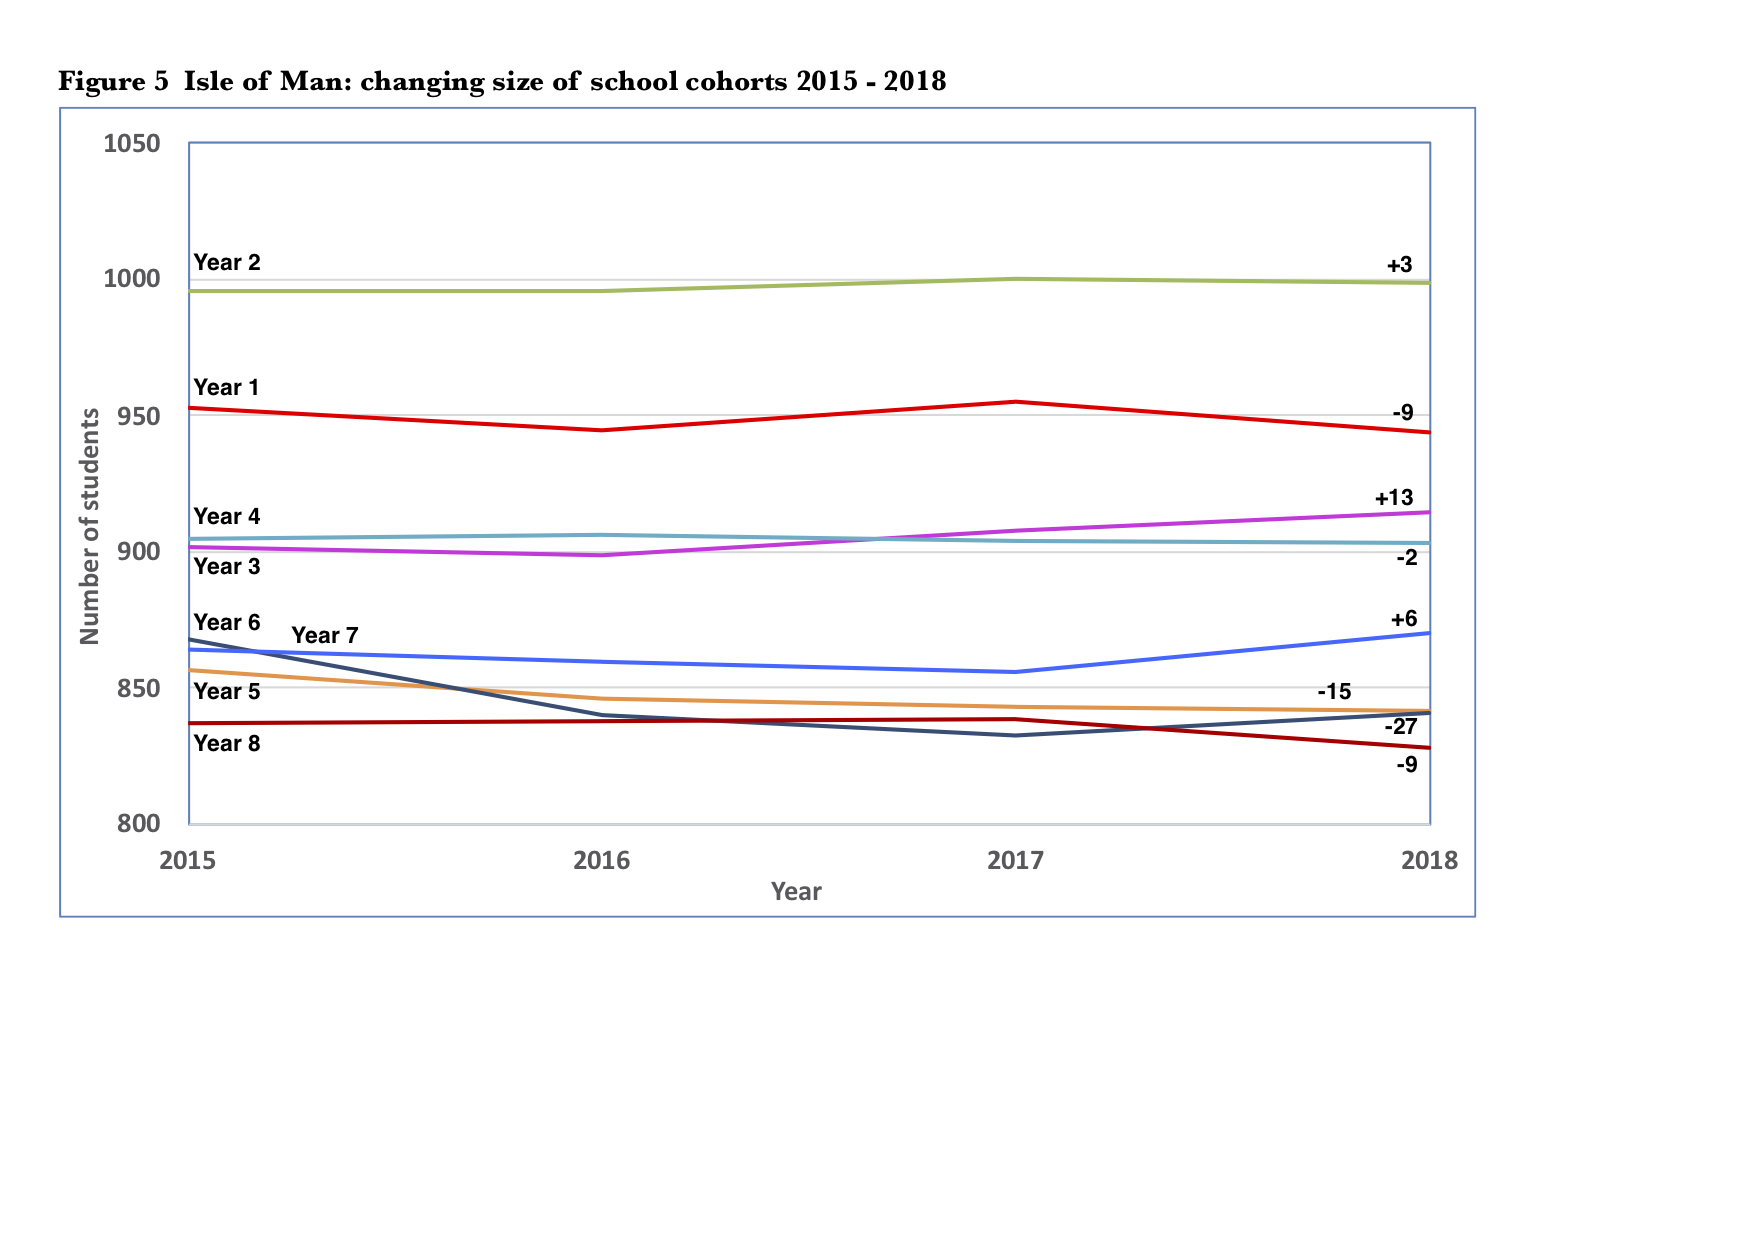
The final graph shown here turns to another different source of data. At the start of the school terms, and especially at the start of a new school year, the Department of Education, Sport and Culture (DESC) gathers data on the number of pupils in every school at every age level. Figure 5 shows how the year cohorts from Year 1 to Year 8 (Years 1 - 6 are primary, 7 - 8 are secondary) have changed in the three years between September 2015 and September 2018 as they have passed upward through the schools. Taking the cohorts as two groups, the graph shows that the Year groups 2, 3 and 7 of 2015 all increased in size as they became Years 5, 6 and 10 of 2018 as more students arrived than left. Together these cohorts added 22 to their number. However, Years 1, 4, 5, 6 and 8 of 2015 all declined as they move on to become Years 4, 7, 8, 9 and 11 of 2018, between them losing 62 pupils. On balance these 8 cohorts containing more than 7,000 students lost 40 pupils over a three year period. The losses are small, but there is certainly no evidence of growth.
The data represents only the DESC schools so there may be some discrepancy due to pupils entering or leaving these schools to or from the Buchan or King William’s College or, similarly, to and from home education. But there can be little doubt that there have not been net migration gains in these age groups over this period of time.
Comment
The population of the Isle of Man clearly remains extremely vulnerable: the threat of population decline is still in evidence, population ageing is pushing the Island to an extreme position globally, the decline in the number of births is a serious issue in its own right, the Island age structure is increasingly imbalanced. These changes are happening despite economic growth, low unemployment, enormous incentives available to employers, changes to the work permit system, pre-school credits and planning priority on economy benefits.
There remains a need for a clear population policy to clarify what we are trying to achieve, for research to improve our understanding of the issues, for improved monitoring so we know more about current trends and for targeted interventions to bring about change.