School rolls September 2021
The years between 2010 and 2020 saw a remarkable 35.5% decline in the number of births in the Isle of Man (from 1,023 in 2010 to 660 in 2020). The latest school rolls data provided by the Department of Education, Sport and Culture (1 November) reflect this trend.
The largest of the compulsory school year groups across the Island’s primary and secondary schools in September 2021 was Year 8 with 1,003 students. This group represents students born in 2009 and 2010. The smallest year group was Year 1 with 785. These students were born in 2016 and 2017. Based on the declining births, we can expect the number of pupils entering our primary schools to decline for at least another five years.
The school rolls data also show that as Years 1 to 6 in 2016 (just a few months after the 2016 Census) passed up through the schools to become Years 6 to 11 in September 2021, the number of pupils in this group hardly changed. Over the five-year period, three year groups experienced small increases (current Years 6, 8 and 9) and three year groups showed small decreases (current Years 7, 10 and 11). The first graph shows how little change there has been since 2016. These figures are actual counts - not estimates.
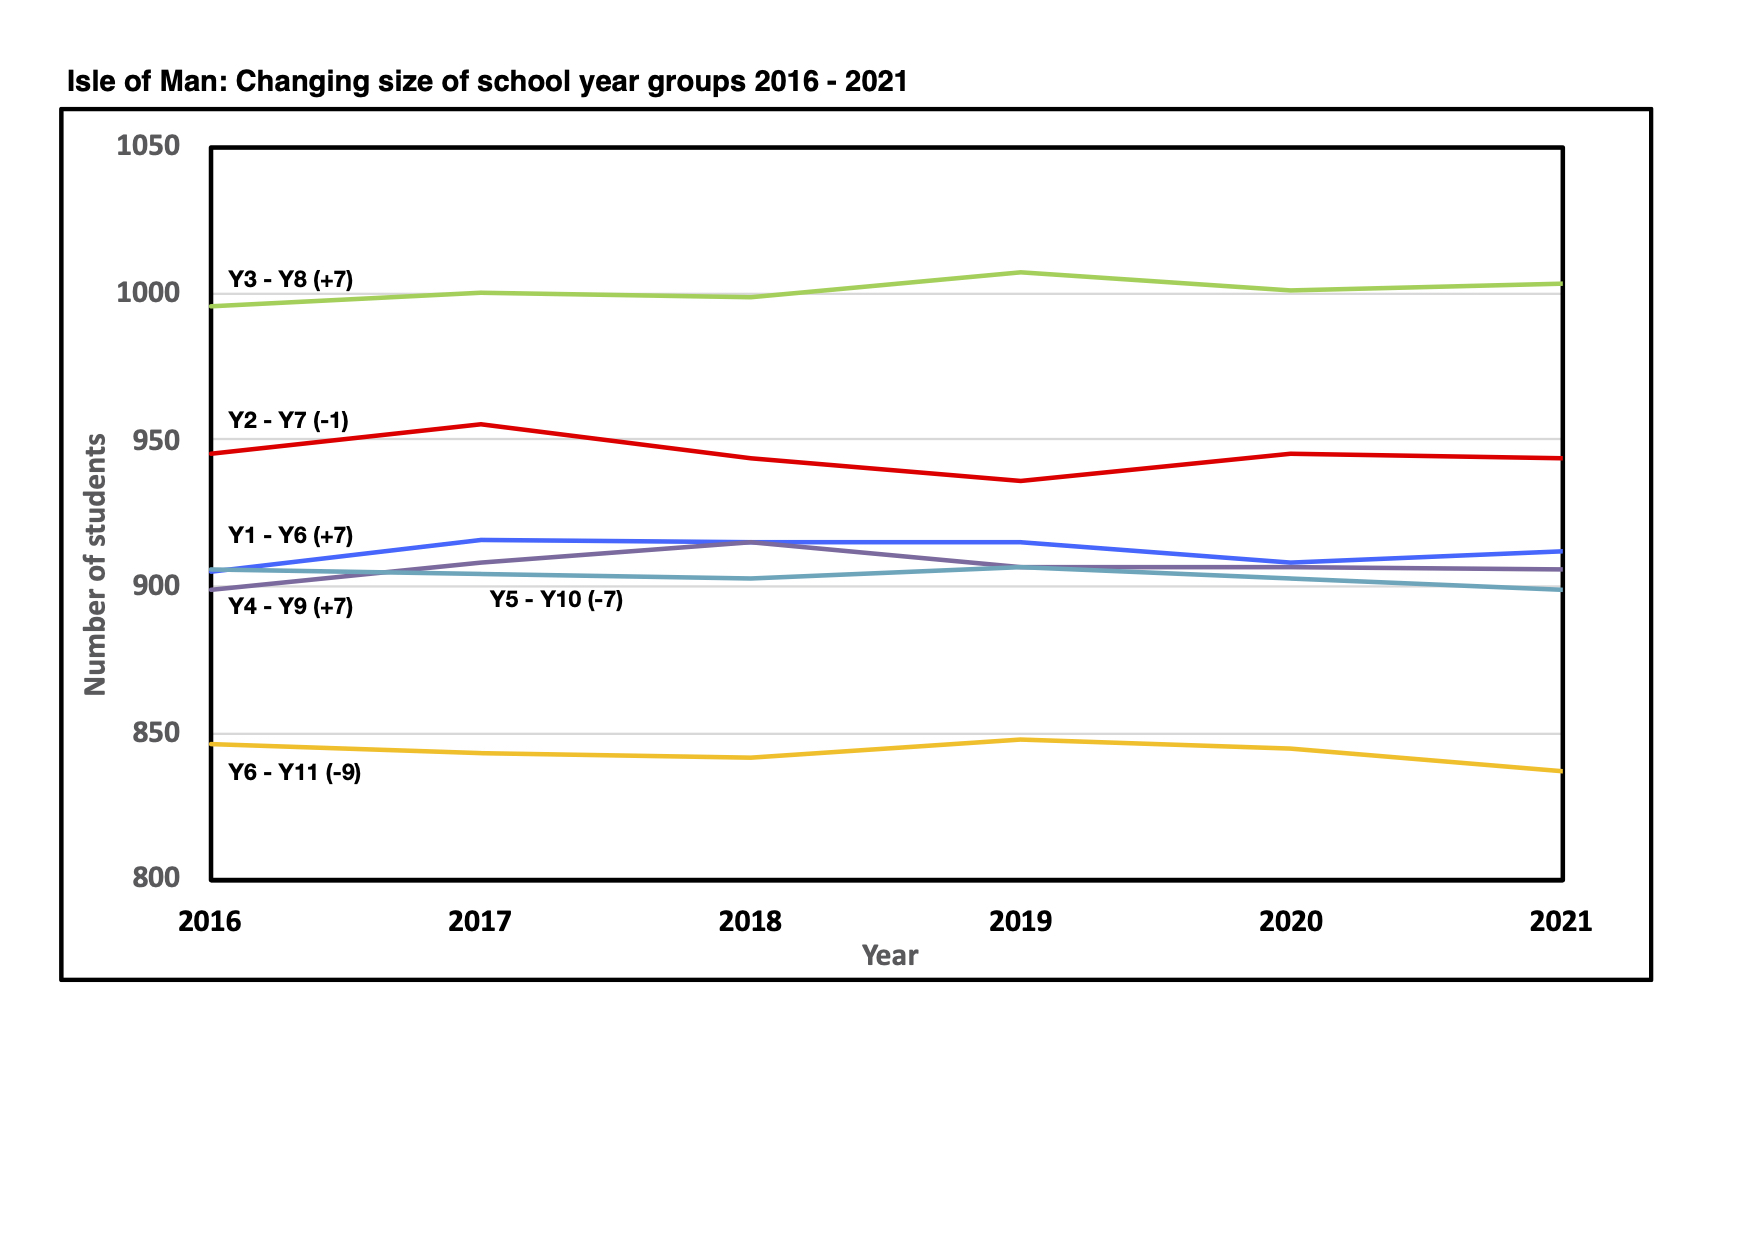
Overall there was a net increase of just 4 students over a 5-year period in a group containing almost 5,500 students. That represents growth of 0.07%.
A closer look at the data shows that this student group actually peaked in 2017 and has declined by 25 since that date.
As year groups pass up through the schools, numbers can only be gained or lost through migrations to and from the Isle of Man, or by the relatively small number of pupils entering or leaving the DESC schools for education that is private or ‘otherwise’ (home education).
The school rolls data provide no evidence of net migration gain or net migration loss in families in the Isle of Man between the two censuses.
Population estimates 3rd Quarter 2021
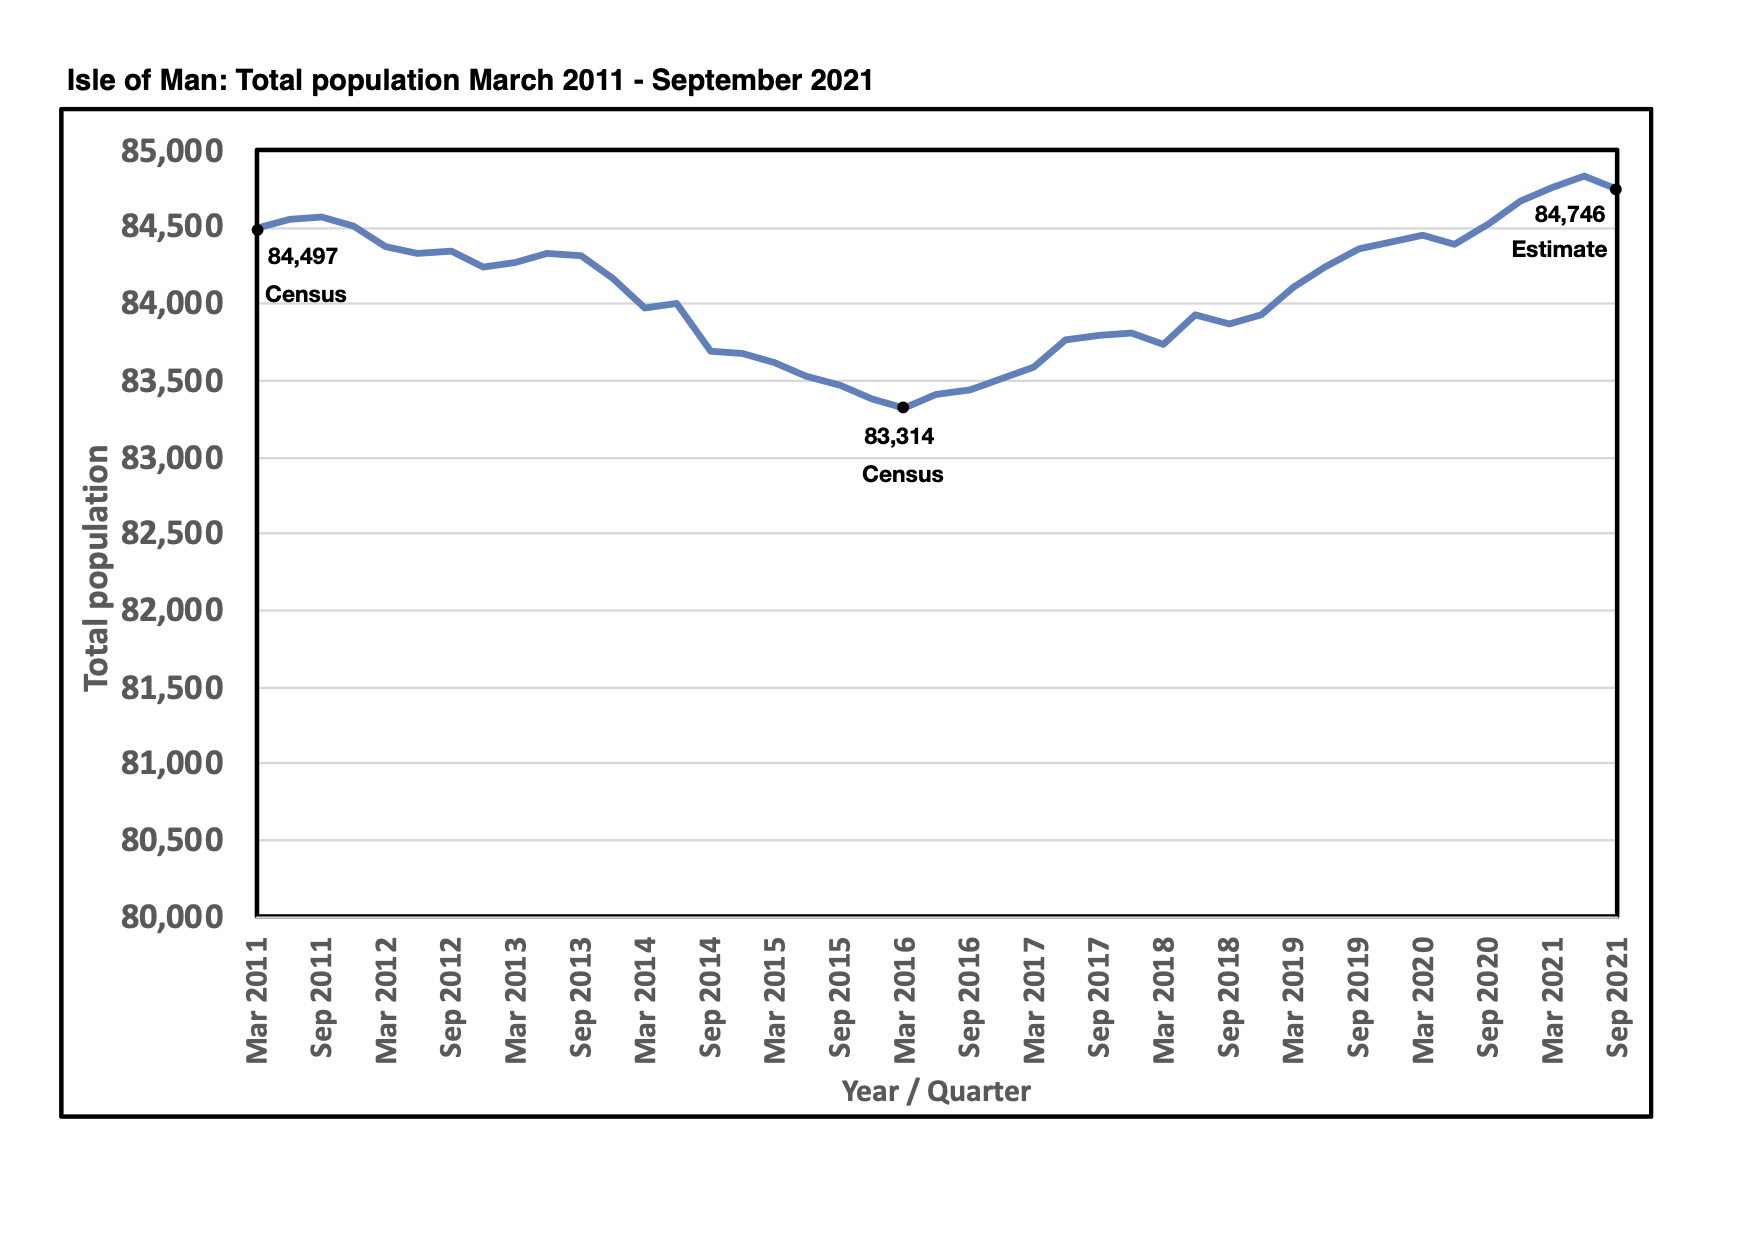
The Government population estimates for the end of September 2021 (3rd quarter) were provided by the Economic Affairs Division in late October. The second graph shows the actual resident populations at the time of the 2011 Census (84,497) and the 2016 Census (83,314). During the period between those years the resident population of the Isle of Man fell by over 1,180 (or 1.4%). Those figures are taken from the census counts.
The graph also shows the Government estimate of the Island’s population between the 2016 Census and the end of September 2021, based entirely on the number of people registered with GPs. This suggests that the Island's resident population may have peaked in June this year at 84,829 before falling back to 84,746.
Readers of previous blogs will be aware that the relationship between the number of people registered with GPs and the number of people recorded in censuses is not straightforward. Current estimates are based on the number of people registered with GPs minus approximately 4.2%, which reflects the nature of the gap that was present at the 2016 Census.
As we wait for the 2021 Census report, the best we can say is that the estimates are “uncertain”.
Population ageing
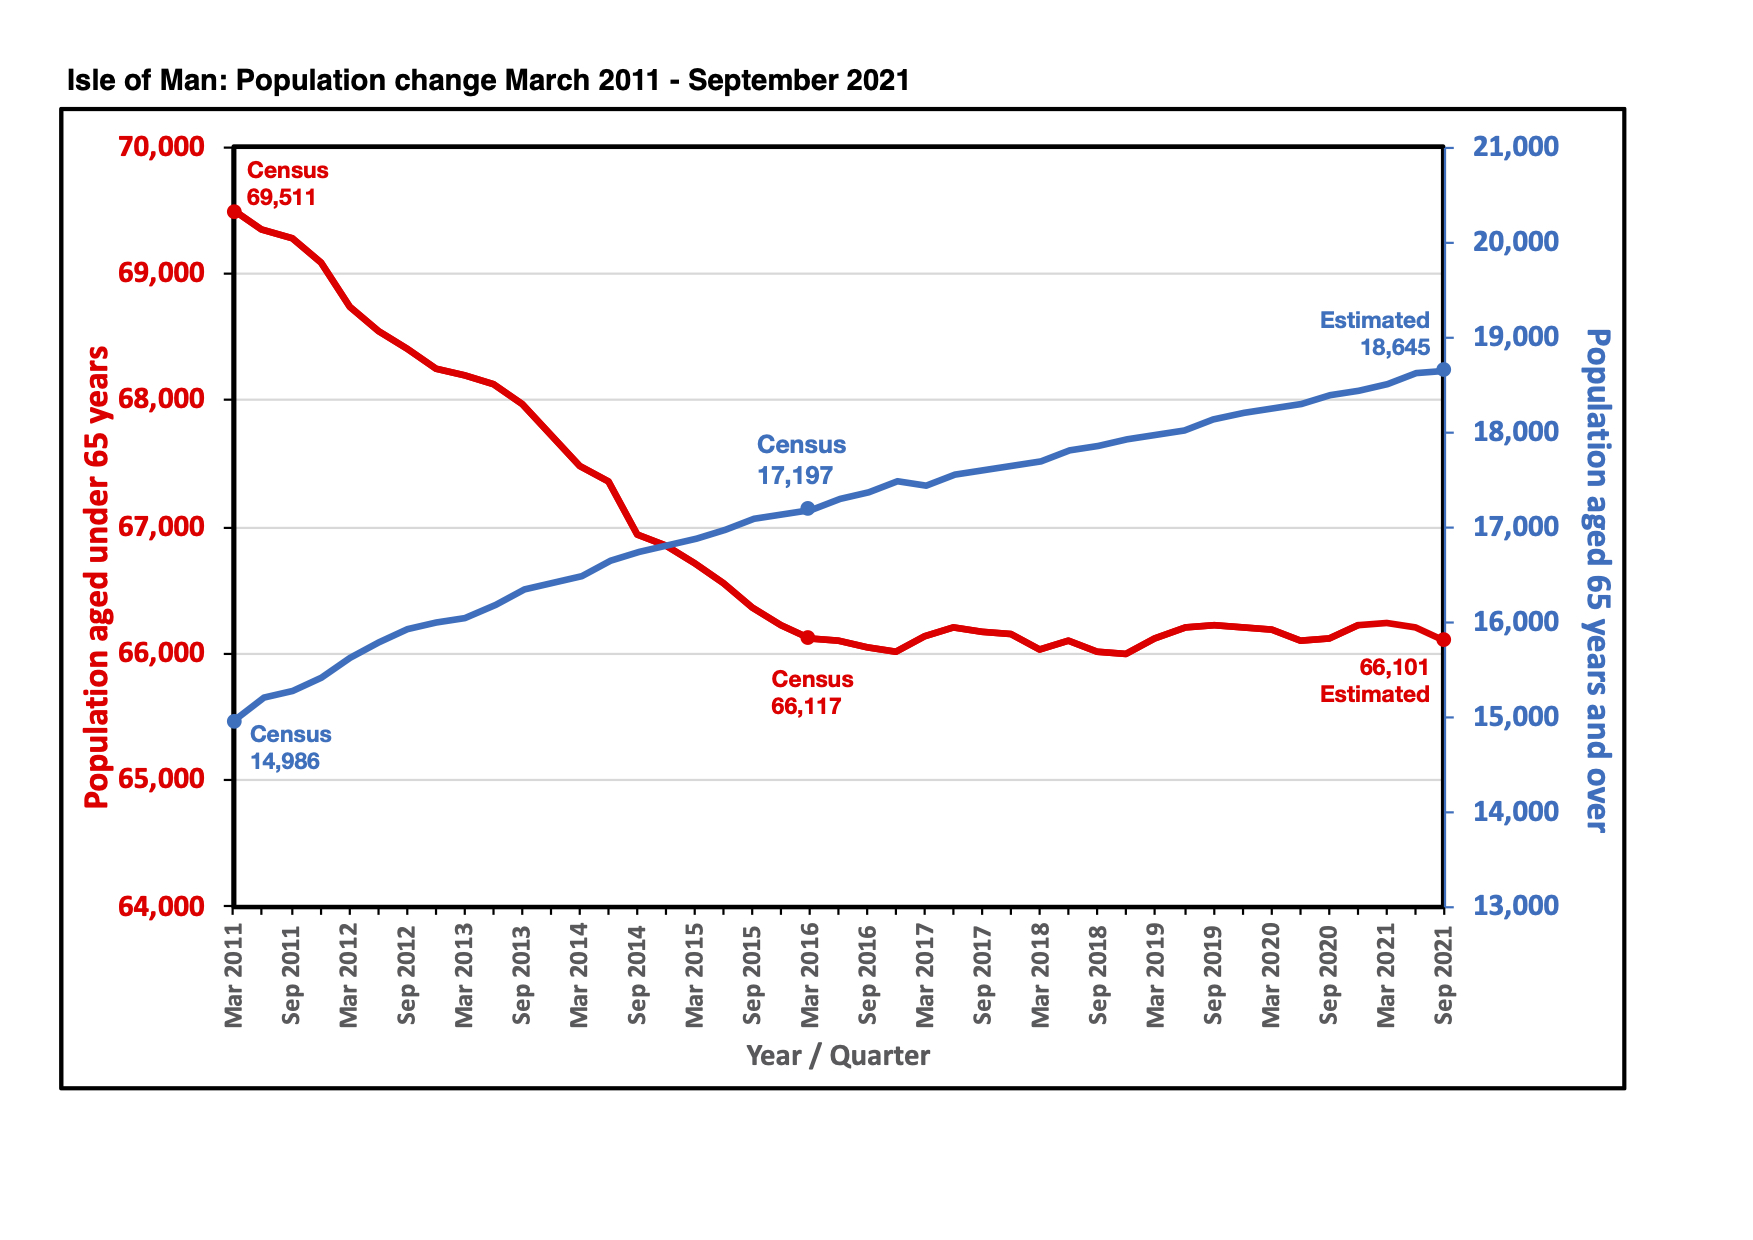
The third graph provides a stark reminder of the extent of the decline in the population aged under 65 years between 2011 and 2016 - a fall of nearly 3,400 (4.9%) in five years. In sharp contrast, the blue line shows the increase in the population aged over 65 between 2011 and 2016 – an increase of over 2,200 (14.8%) over the same period. These figures are from census counts.
The blue and red lines on the graph after 2016 are Government estimates. The number of people aged over 65 years (shown in blue) is now believed to have reached over 18,600. 22.0% of the estimated total population is believed to be aged over 65, which would keep the Isle of Man in the group of countries with the oldest populations along with Japan, Italy, Portugal, Finland, Germany and Greece.
The estimated number of people aged under 65 years (in red) has been – for want of a better expression – “flatlining” since 2016. There actually appears to be 16 fewer people aged under 65 than there were five years ago. Ten years on from the 2011 Census the estimates suggest that the under 65 population remains over 3,400 smaller than it was.
Possibility of some net migration gain?
Something to note is that the number of births recorded since 2016 has been low and falling, annually adding declining numbers to the under 65 population in a range from 758 to 660. At the other end of the age range, each year the number of people turning 65 years and therefore leaving the under 65 population has been approximately 1,000 (every age group between 60 and 64 years in 2016 recorded more than 1,000 people). We might expect the gap between these figures to result in a decline in the under 65 population of around 300 per year.
If the total population aged under 65 years is, indeed, flatlining, as suggested by the estimates, the gap must have been eliminated by a slow level of net migration gain of the order of 300 people per year in the under 65 years population.
Returning to the start of this blog – the possibility of net migration gain in the under 65 population is not supported by the school rolls data.
The “uncertainties” remain.