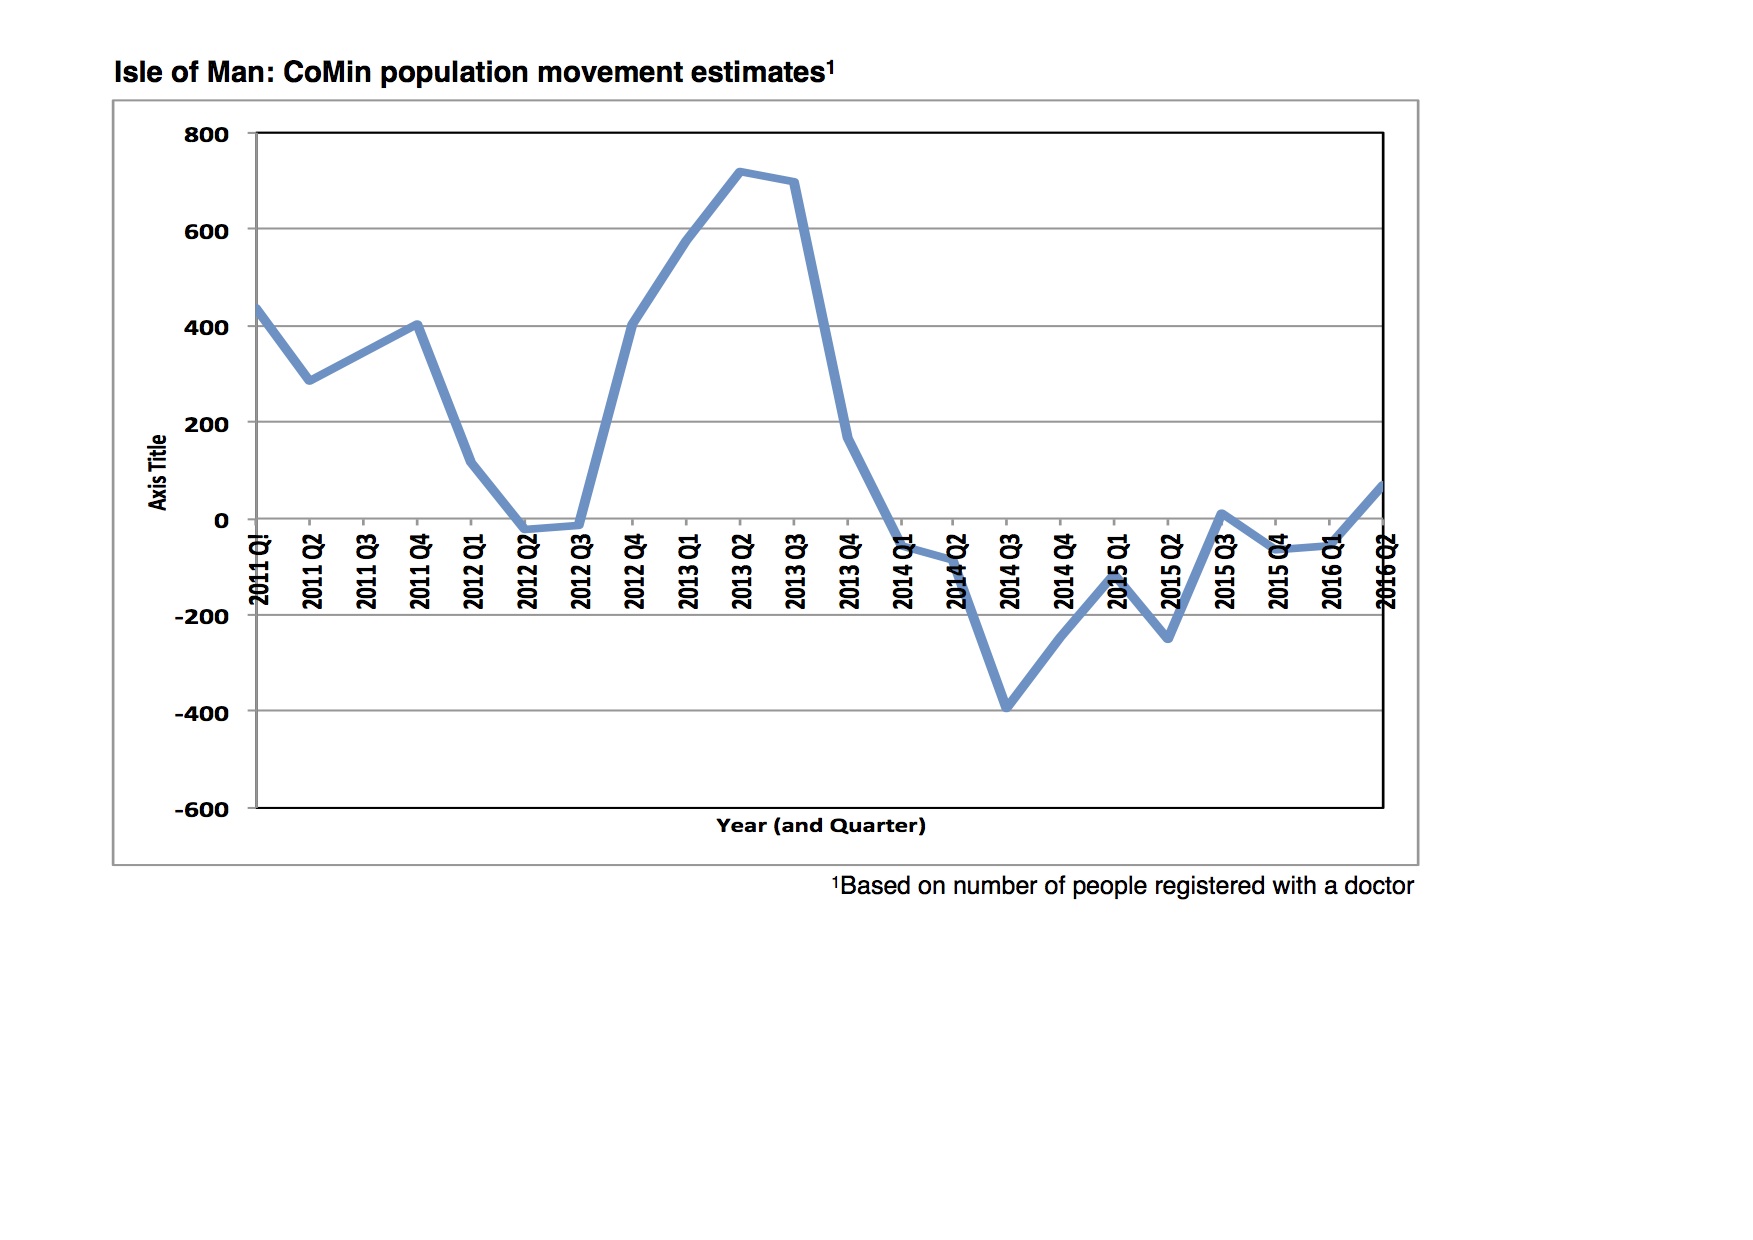
The latest quarterly economic report to the Council of Ministers (covering April - June 2016) was published last week. For the second time, the report included a population estimate or, more accurately, an estimate of population movement based on what the report refers to as 'GP Capitation numbers adjusted for ghosts as per Census'. In other words it is based on data showing the number of people registered with a doctor adjusted to tie it in with the actual 2011 population count. The graph below (redrawn from the graph in the report) shows estimated population change in relation to the same period in the previous year. The slight rise at the very end of the graph shows that at the end of the second quarter (i.e. the end of June 2016) the population was estimated to be 70 higher than at the end of June 2015.
This is positive news. Throughout 2013 there was population growth in every quarter, with growth in excess of 700 during the second and third quarters. Since the start of 2014 there has been population decline in almost every quarter with decline of almost 400 recorded for the third quarter.
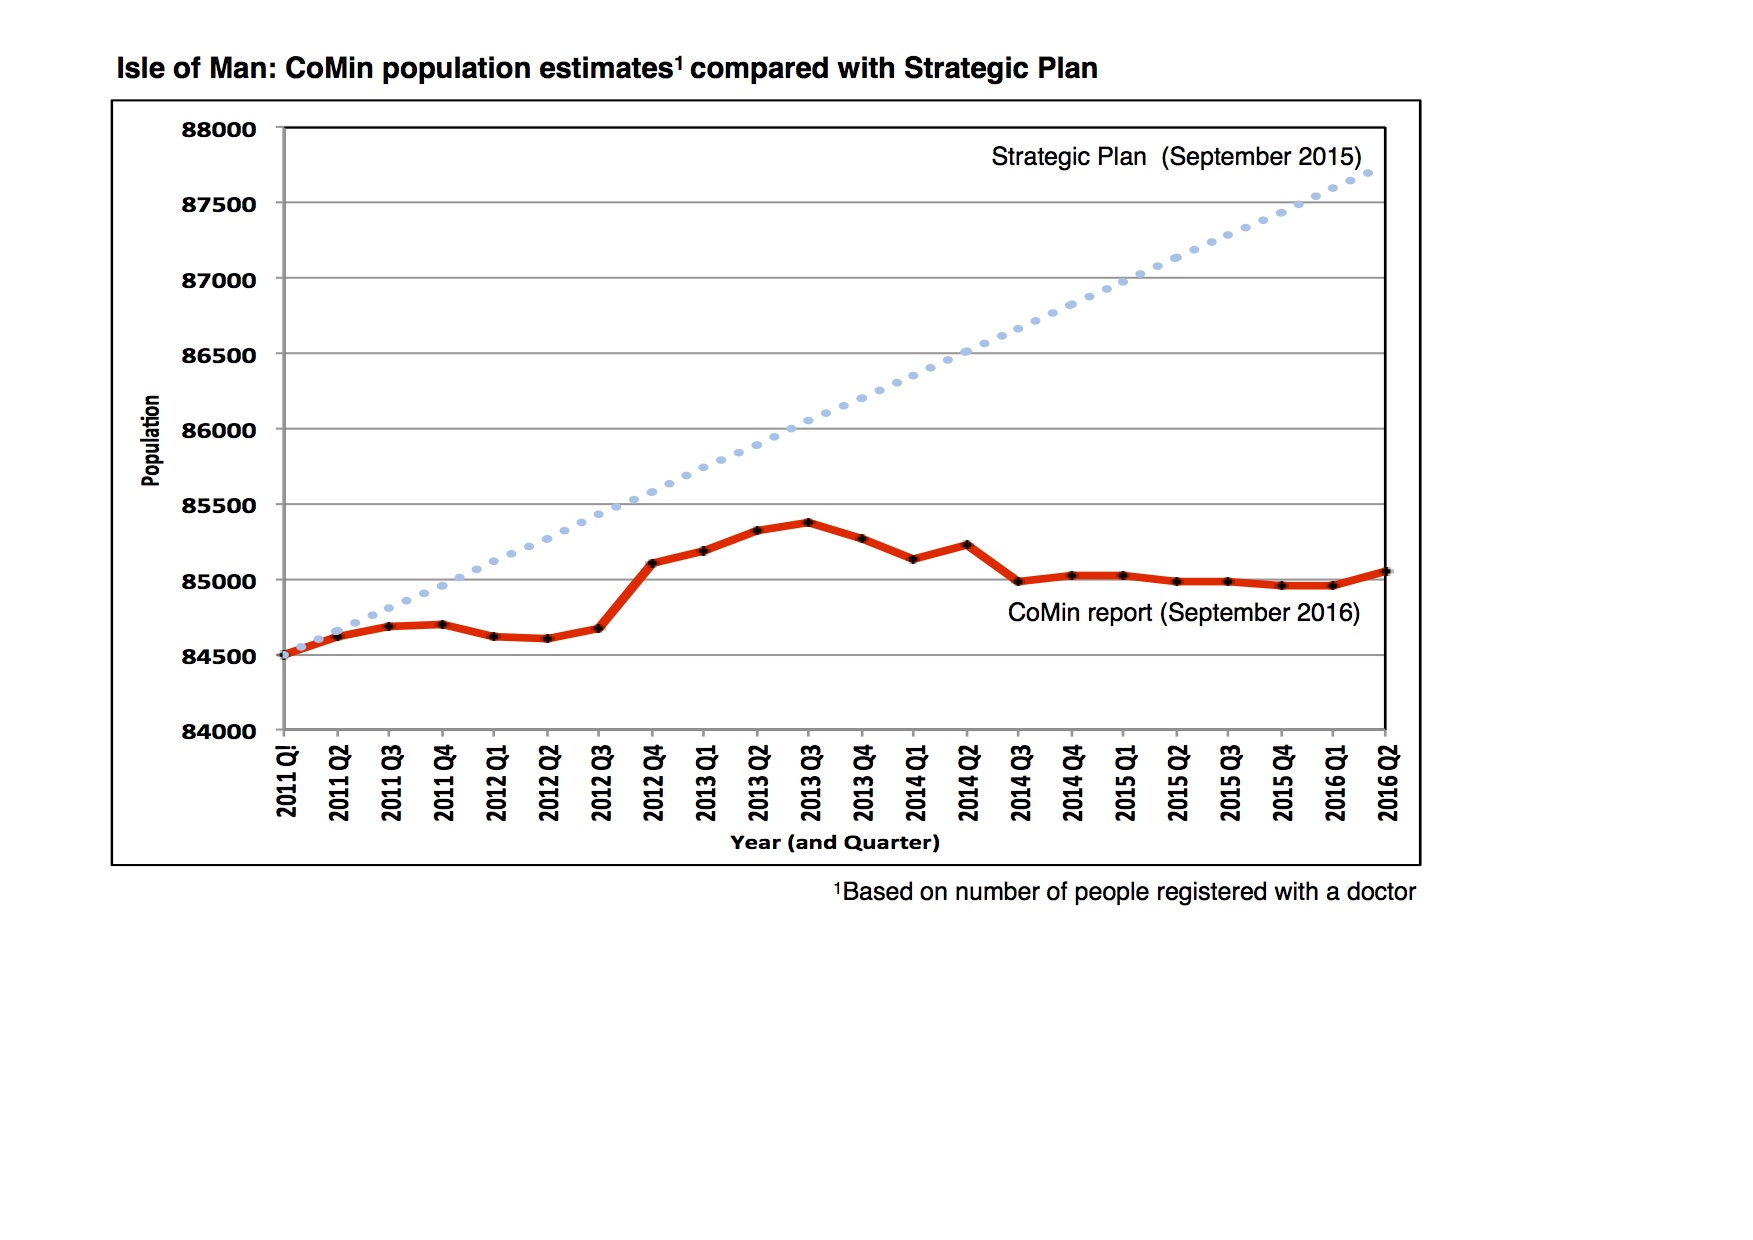
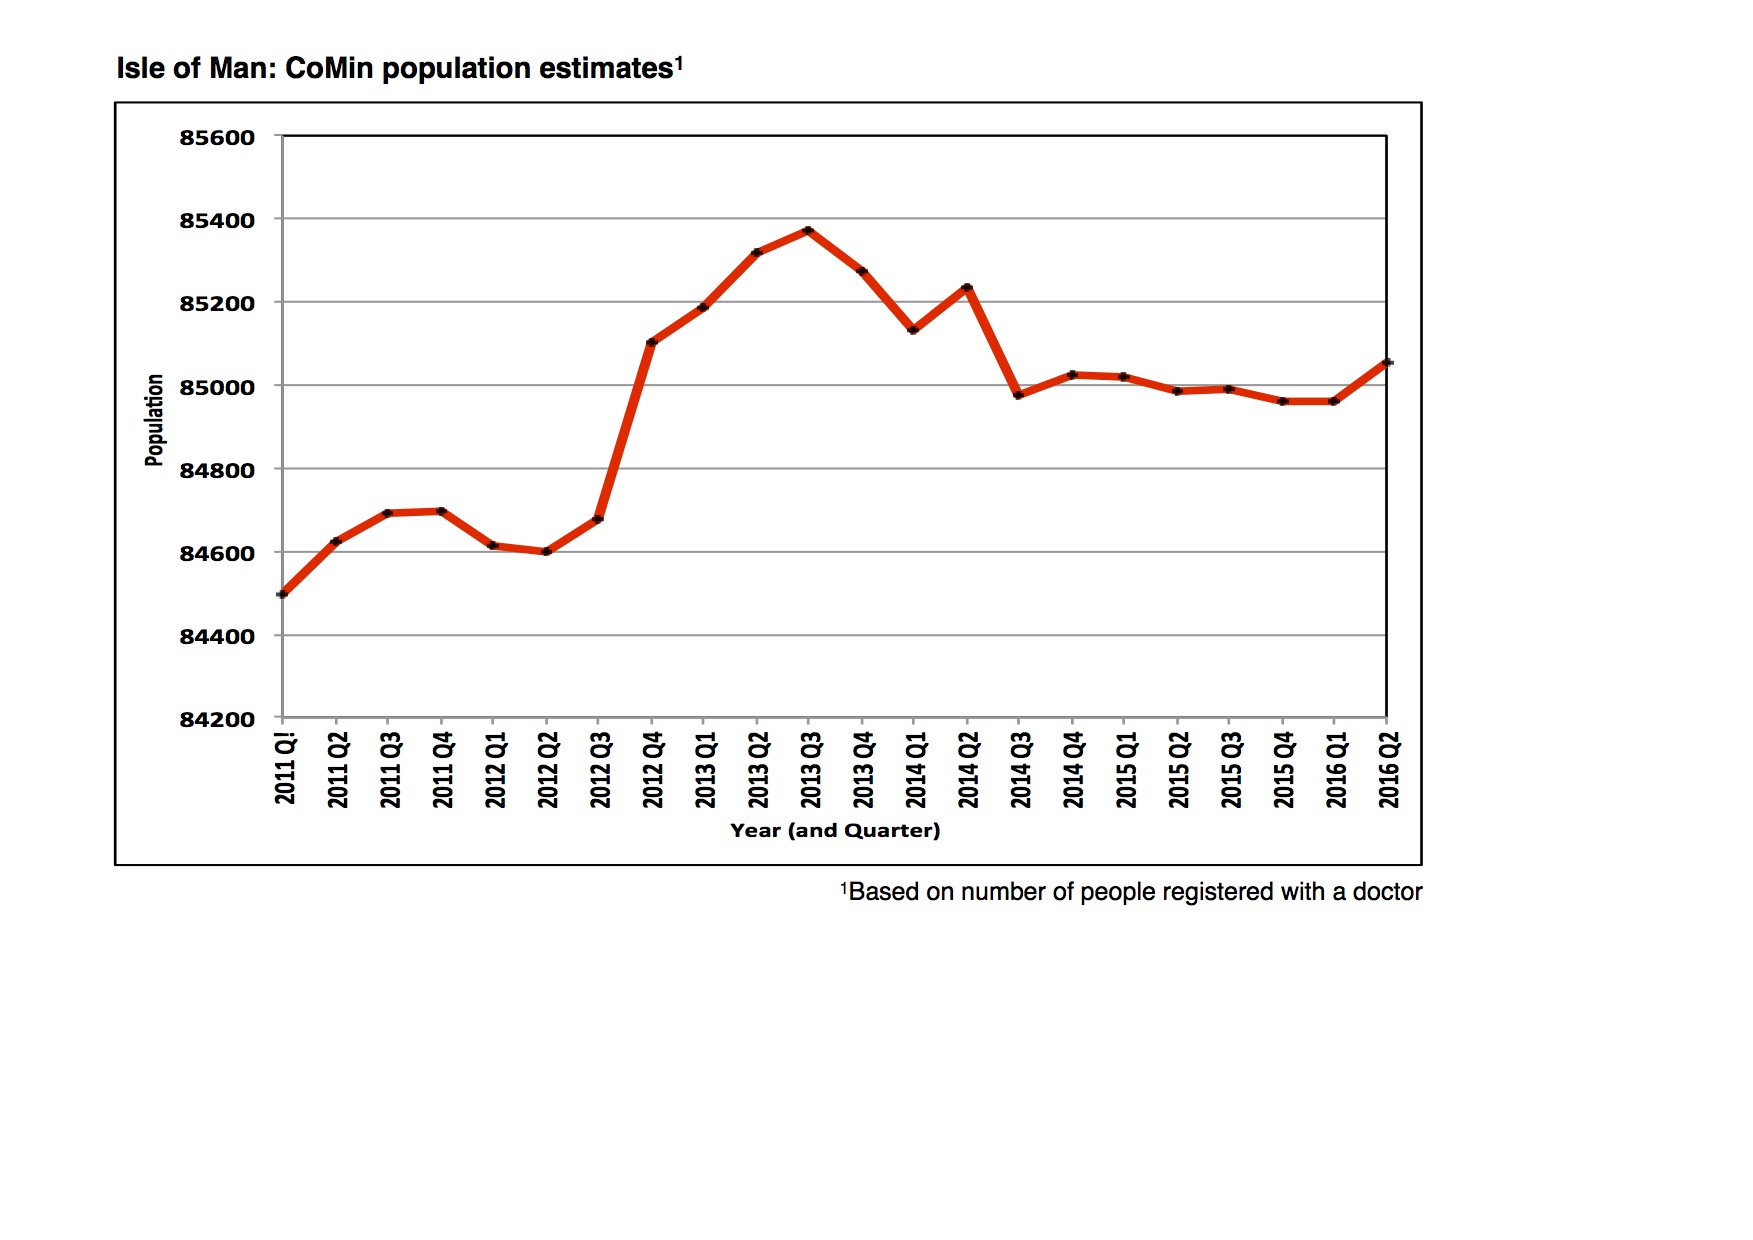
The second graph makes use of additional data provided by the Economic Affairs Unit in Cabinet Office and offering a very significant step up in the monitoring of population. It shows an estimate of the population each quarter since the end of March 2011.
The estimated population of the Isle of Man at the end of June 2016 stands at 85,056.
Between 2006 and 2011, population had been rising at an average of 800 people per year. The graph starts with the 2011 census figure of 84,497. Following a slight dip in population in the first half of 2012, the estimate shows population growth up to a peak of 85,372 in September 2013. With some fluctuation, the general picture since the start of 2014 has been one of estimated population decline. It is too early to tell whether the increase in the April-June period in 2016 heralds a new trend of population growth or simply a brief fluctuation. There are some economic green shoots that encourage optimism: there has been growth in the Island's reserves and in the National Insurance Fund; the number of people in the workforce is growing; economic growth is running at over 5% in real terms and unemployment, already low, is falling.
The third graph provides a reminder of the government expectations that were built into the Strategic Plan (the Island's main planning document) as recently as September 2015. Official population projections produced in 2011 and based on the census data that year assumed net immigration of 500 per year leading to a population of 87,600 by 2016. These were using in the Draft Strategic Plan 2015 Inquiry, which determined not to permit interrogation of the projections.
The headline figures for the 2016 interim census are likely to be published in the near future even though the full report may not be out until later. If the population estimates are correct, the census will show a resident population of around 85,000 in April 2016. The Strategic Plan needs to be subjected to a focussed review to take account of the lower population before it leads to an over-identification of land for future housing needs in the Area Plans for the East and West.
The Island's population remains vulnerable but improved monitoring represents the first step towards taking appropriate action. There needs to be a debate about population (inside and outside of Tynwald) to decide what the Island's policy towards population growth should be and how best to achieve it.