There is evidence that the Isle of Man moved from a position of net immigration to balanced migration or even net emigration between 2011 and 2015.
The following images and notes offer very brief coverage of the contents of the Isle of Man Population Atlas.
Chapter 5: Immigration, Emigration, Policy and Beyond 2016
Immigration and Emigration
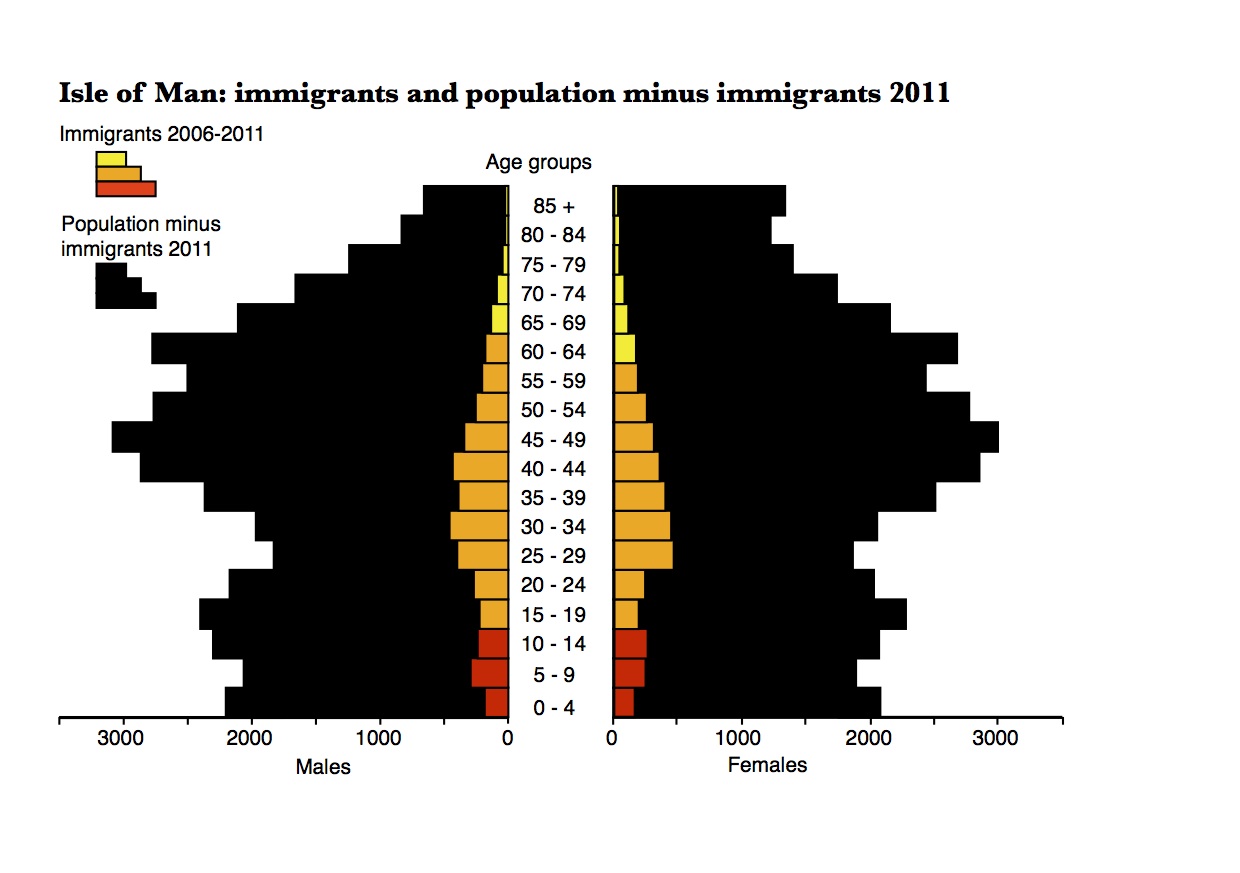
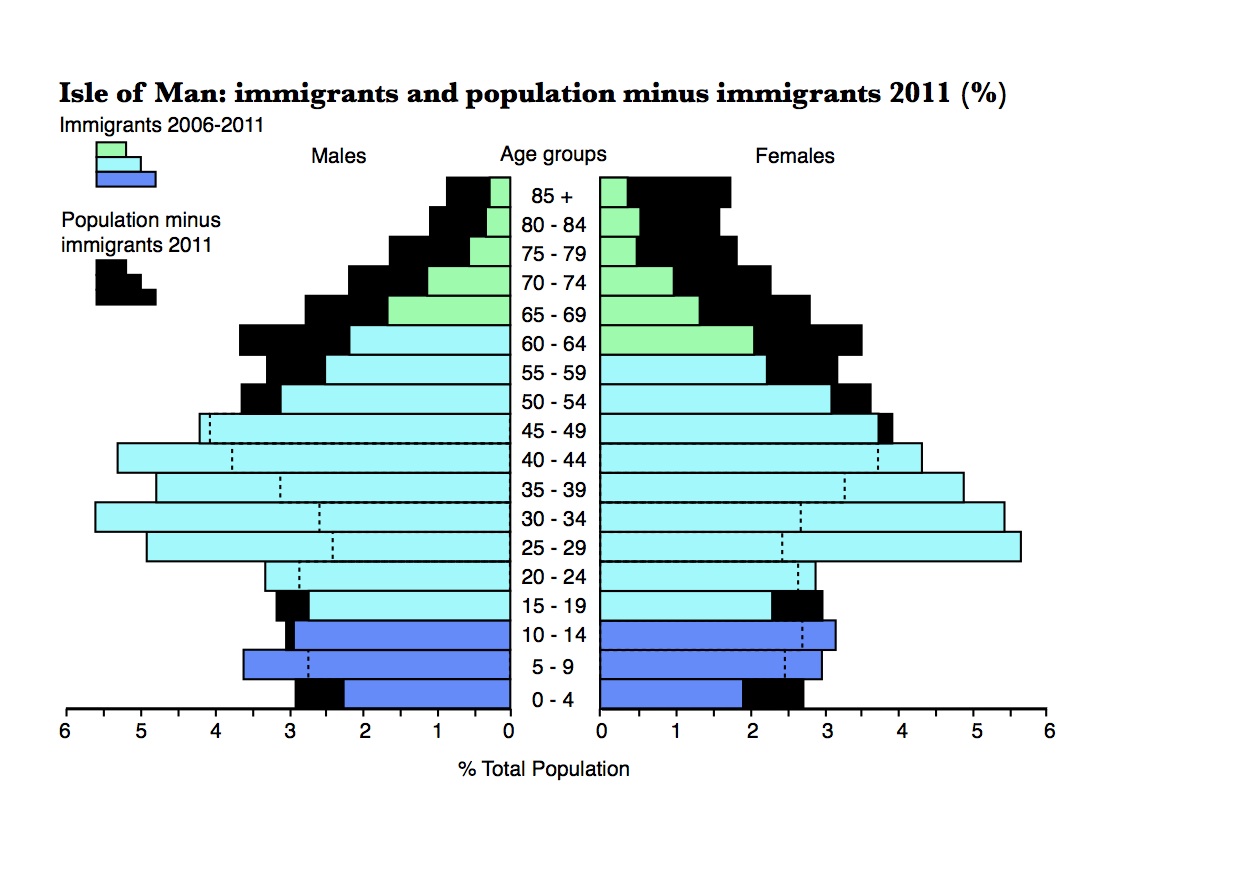
Since the start of the 1970s, immigrants to the Isle of Man (i.e. people who have moved to the Isle of Man from elsewhere - they may have been born on the Isle of Man) have consistently been younger than the total population. The graphs below show the age profiles of the 8,179 immigrants (numerical on left, percentage on right). The largest cohorts in the immigrant group were in the age range 25 - 44 years. According to 2011 census data, the immigrant arrivals between 2006 and 2011 had a median age (half of the population older and half younger) of 34.9 years compared with 41.5 years for the population as a whole. The median ages of the immigrants recorded in 2006 and 2001 were 34.1 years and 33.4 years respectively.
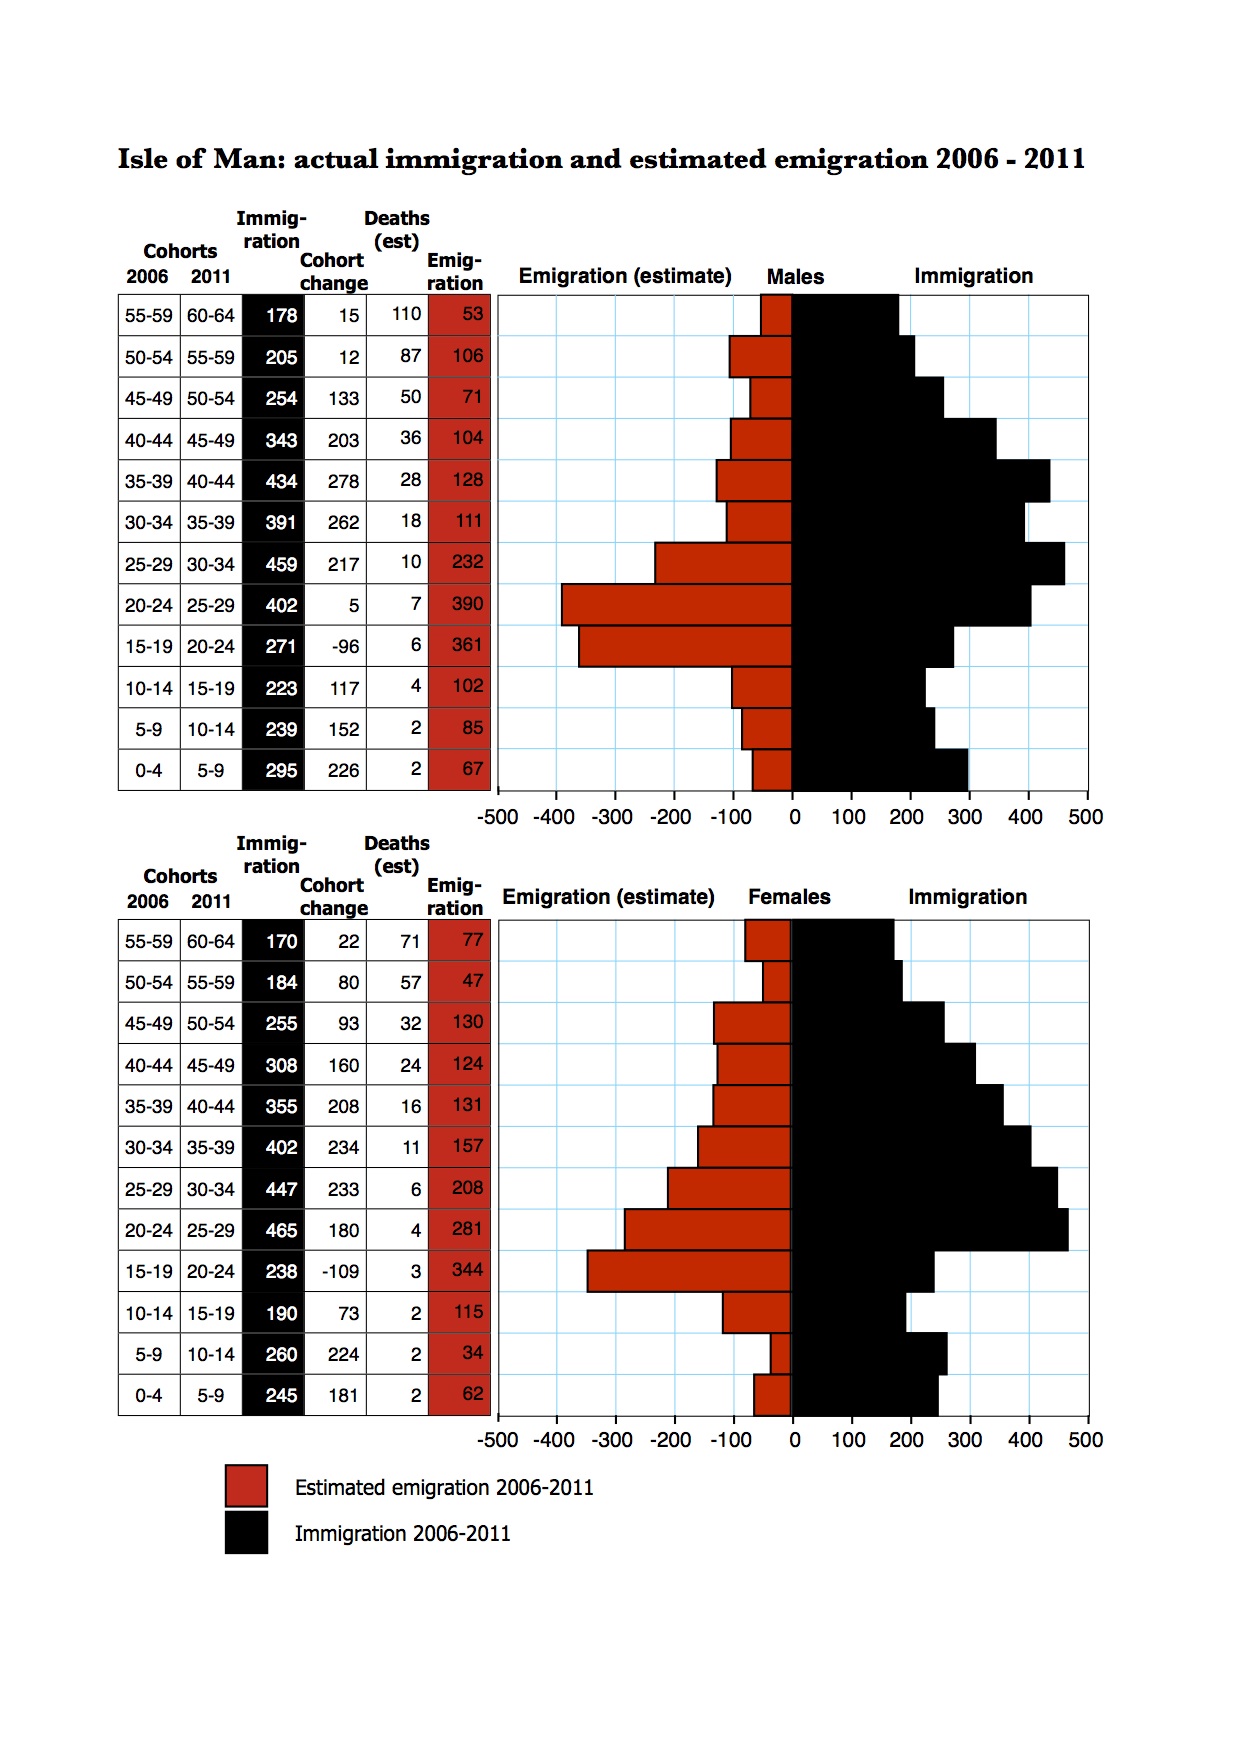
Whilst successive Isle of Man censuses gather information about immigration, they do not carry any tables directly covering emigration. The graphs below show the actual age profile of the immigrant group between 2006 and 2011 in black. The red bars show estimated emigration. This estimate is based on the actual change in the population between the two censuses, the immigration figures and an approximation of the likely number of deaths in each age group (based on UK mortality risk tables). The most notable feature of the graphs is the indication that there was net emigration in the 20-24 years age group of 2011. Just over 500 immigrants were recorded in this group but the estimated number of emigrants was over 700. This is not accounted for by the number of students attending university as they are all still Isle of Man residents.
In both 2006 and 2001 there was net immigration in the 20-24 age group so this is a new trend - the number of young adult residents leaving the Island is greater than the number of young adult residents arriving.
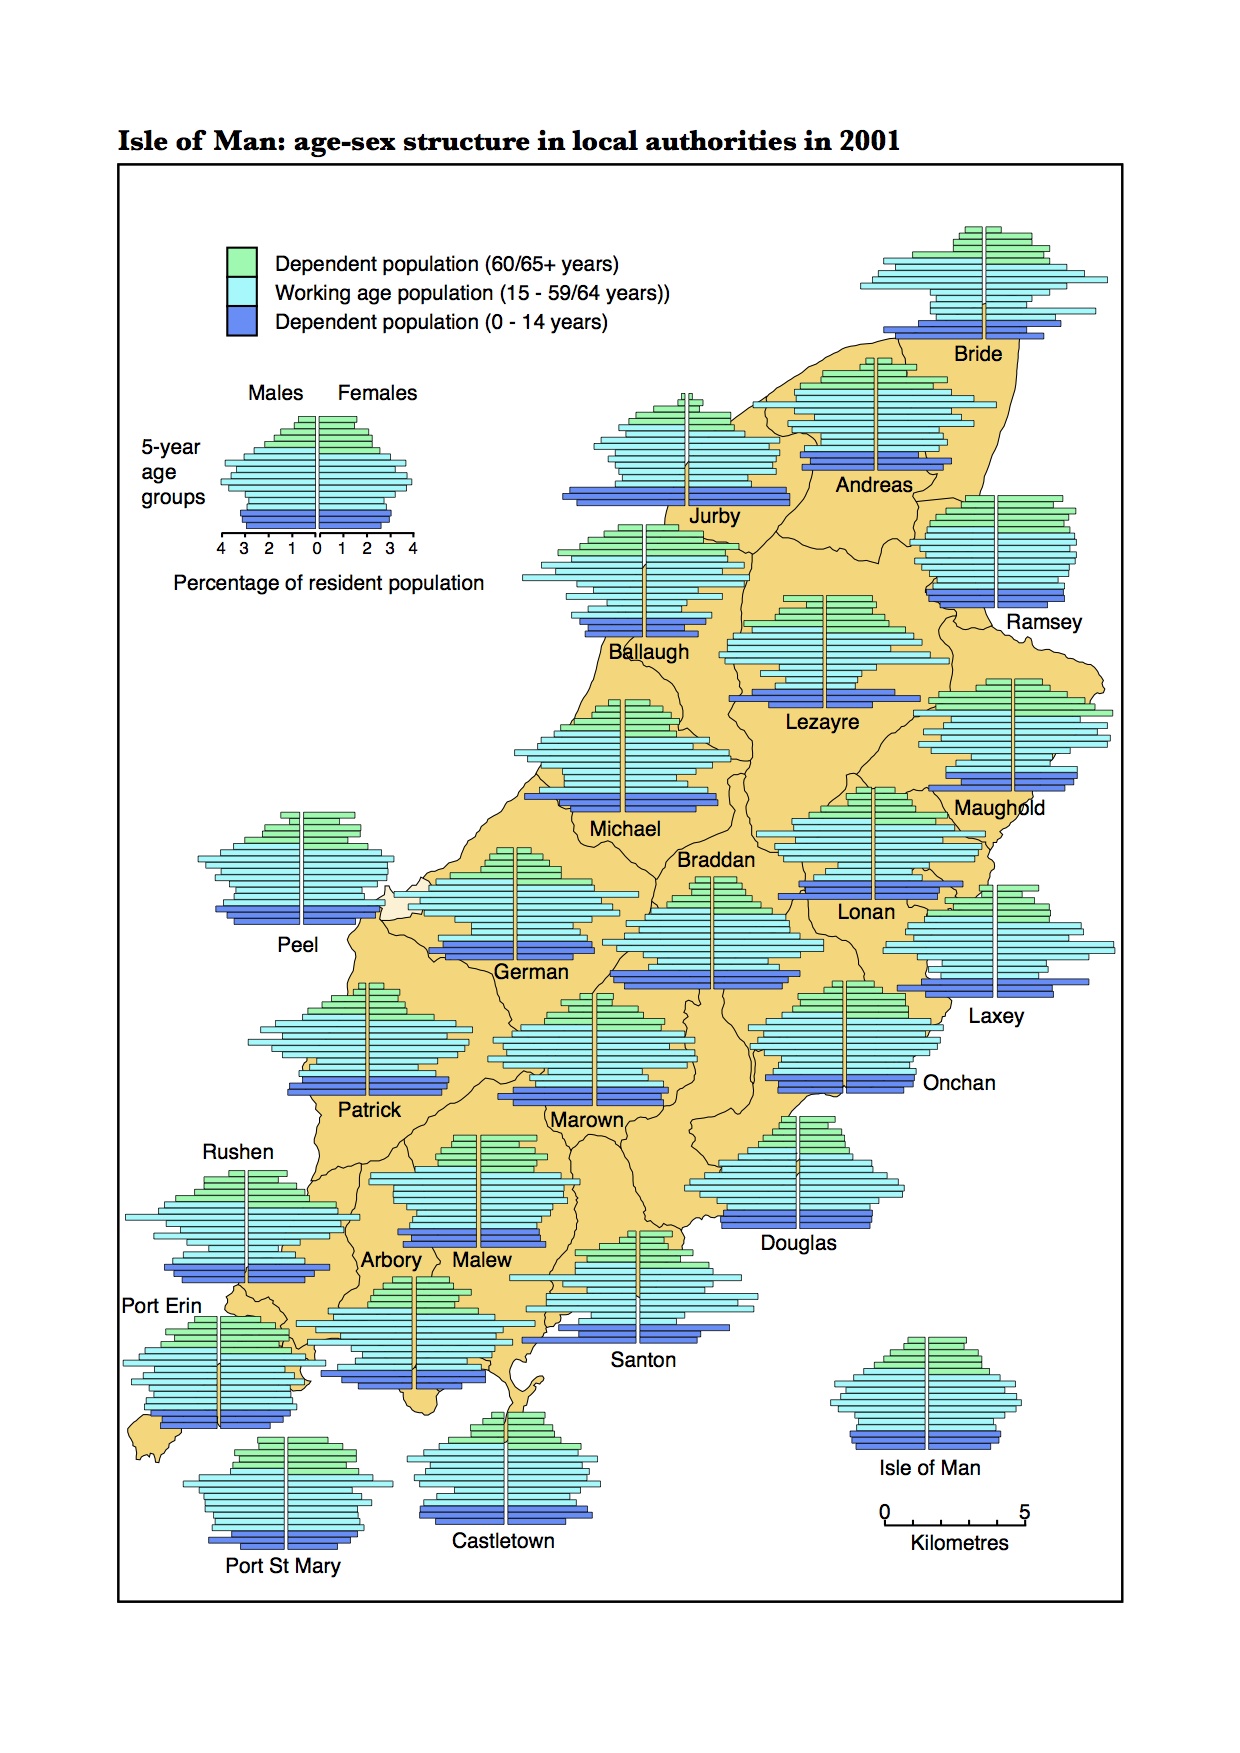
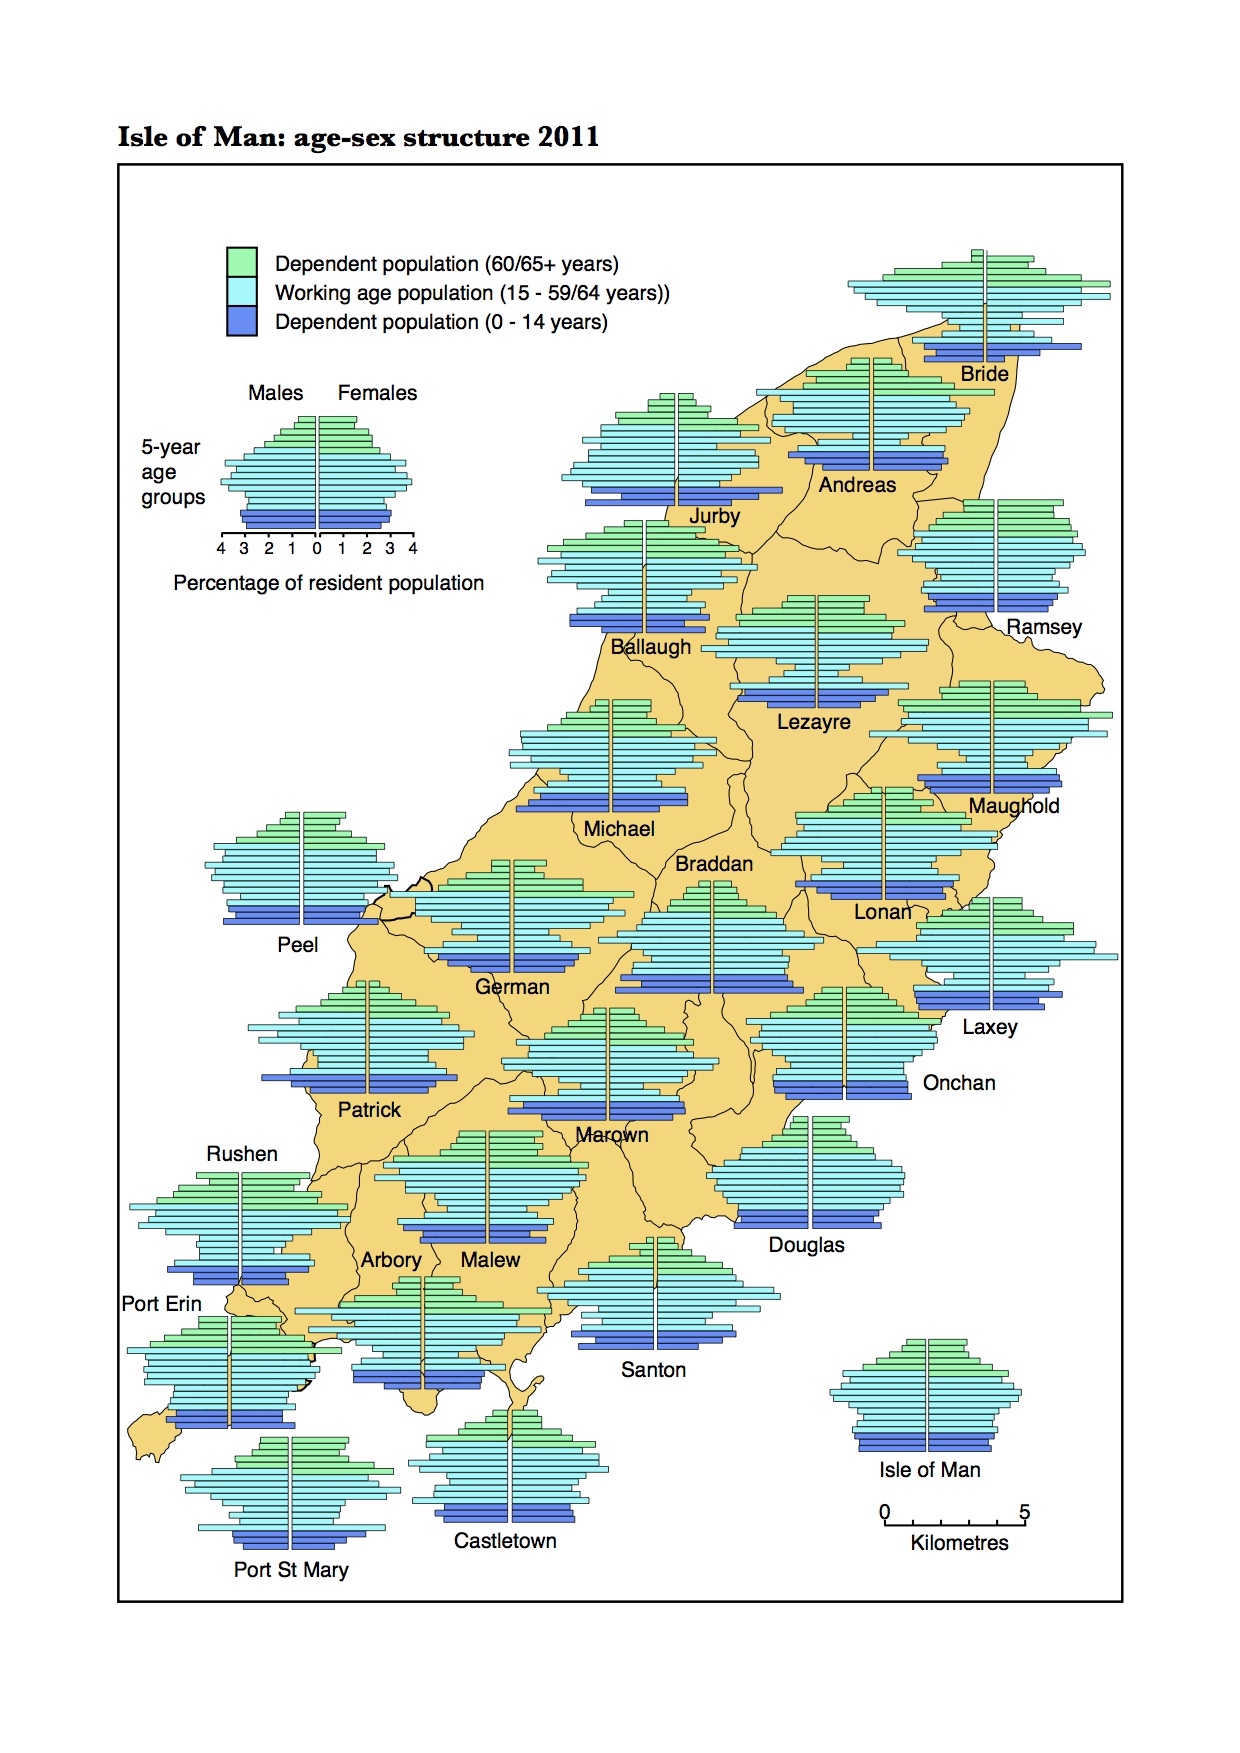
Between 2001 and 2011 it is apparent that some of the Island's 24 local authorities showed a narrowing of their population pyramids in the 20-29 age group reflecting a decline in the number of young adults. In particular, from north to south, the parishes of Bride, Andreas, Lezayre, Maughold, German, Marown, Malew, Arbory and the village of Port St Mary all showed this change. The decline in 20-29 year olds must be due ti migration but it is not clear whether this is emigration (leaving the Isle of Man) or simply outmigration from the local authority (within the Isle of Man). The latter could reflect a lack of affordable accommodation in the rural parishes. This is an area that would warrant further research.
Population slowdown - and decline?
There are a number of information sources that could be used to provide an indicator of population change since the 2011 census. One of those is the number of people registered with a doctor. Between 2006 and 2011, as the population grew by 4,439, the number of people registered with a doctor grew by 4,154. That is, understandably, a very close match. The graph below shows that since 2011 the number of people register with a doctor rose by 123 in 2012 and 147 in 2013. Since 2013 the number of people registered with a doctor has been in decline.

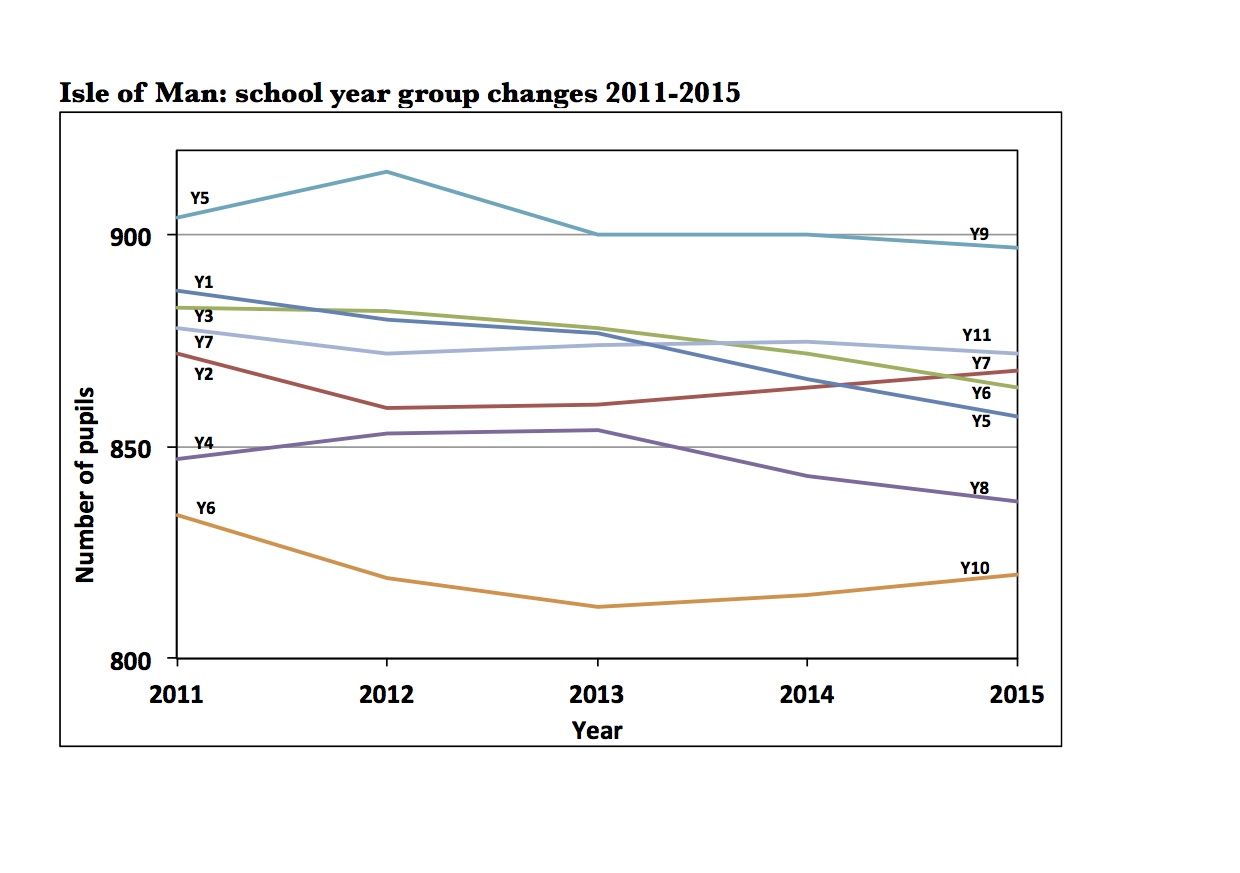
Data from school rolls show that pupil numbers are falling. Not in the sense that the new intake is smaller than the school leavers group, but as the year groups pass up through the primary and secondary schools they are shrinking albeit only slightly. The graph below shows that as the year groups from Year 1 (5 year olds) to Year 7 (11 year olds) in 2011 passed upwards through the school system to become the year groups from Year 5 (9 year olds) to Year 11 (15 year olds) respectively by 2015, their combined numbers fell from 6,105 to 6,015. This decline of 1.47% over 4 years, with every single age group showing a fall, reflects marginal net migration loss in this age group, and presumably also in the age groups containing their parents.
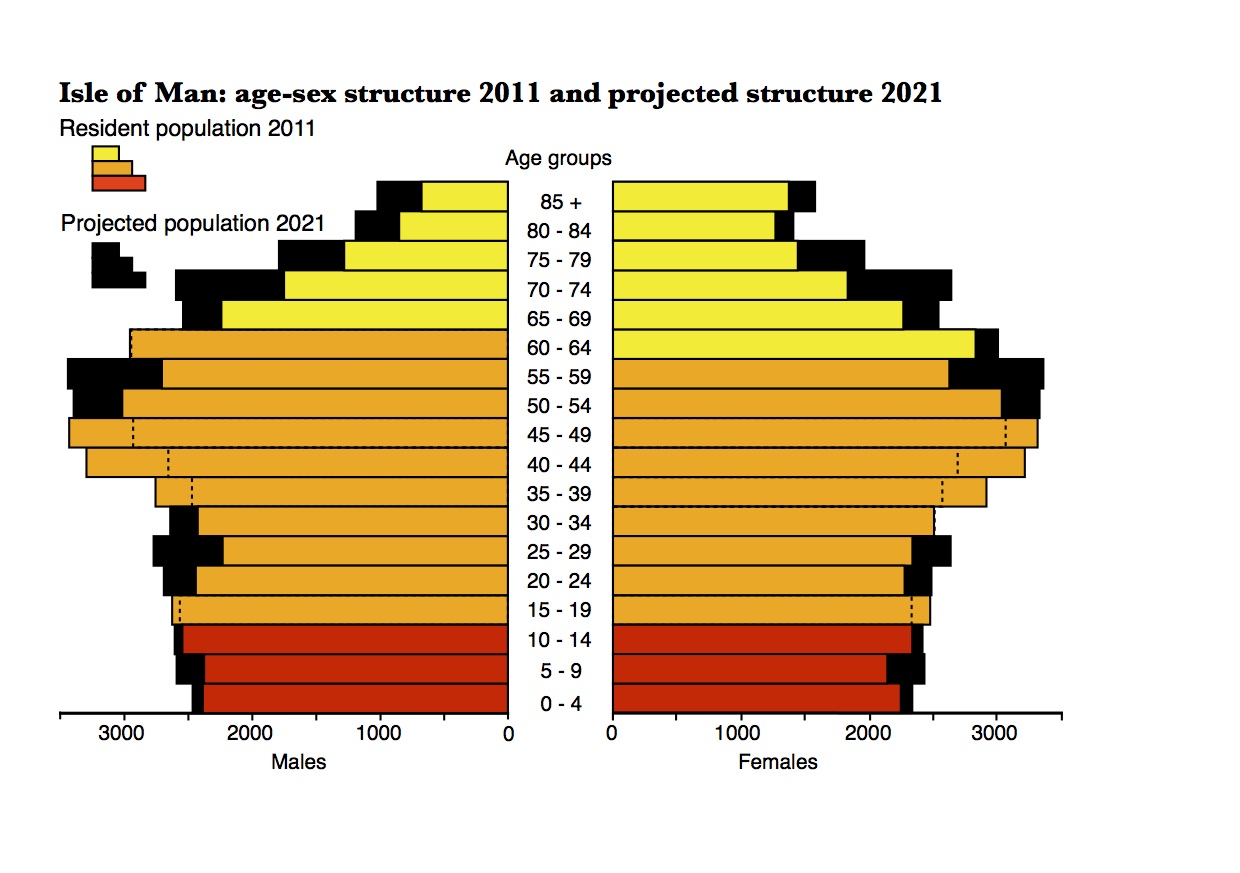
Population projections based on 2011 census data and assuming net migration gain of 500 per year show a projected population of 90,656 by 2021. The projection suggests that every quinary age group over 50 years (with the exception of males aged 60-64) will be larger in 2021 than in 2011. But the projection for 2021 also shows that most of the 0-30 years age groups will be larger in number in 2021 than in 2011 and this is where the population projections are most open to challenge. The population of the Isle of Man in 2016 seems more likely to be in the region of 85,000 than the figure of 87,600 that would half way towards the 2021 projected population.