Page under construction
The focus of Chapter 7 in the Isle of Man Population Atlas is on households, housing and inequality. The following images and notes offer brief coverage of the contents of the Atlas.
Between 2001 and 2011, the population of the Isle of Man grew by 10.7% (8,182 people) but this was outstripped by a growth in the number of households of 12.9% (4,078 households), As a result, the number of people per household fell from 2.37 in 2011 to 2.33 in 2011. To put this decline into a wider context, the number of people per household in 1951 was 3.1. Decreasing household size is part of a long-term trend.
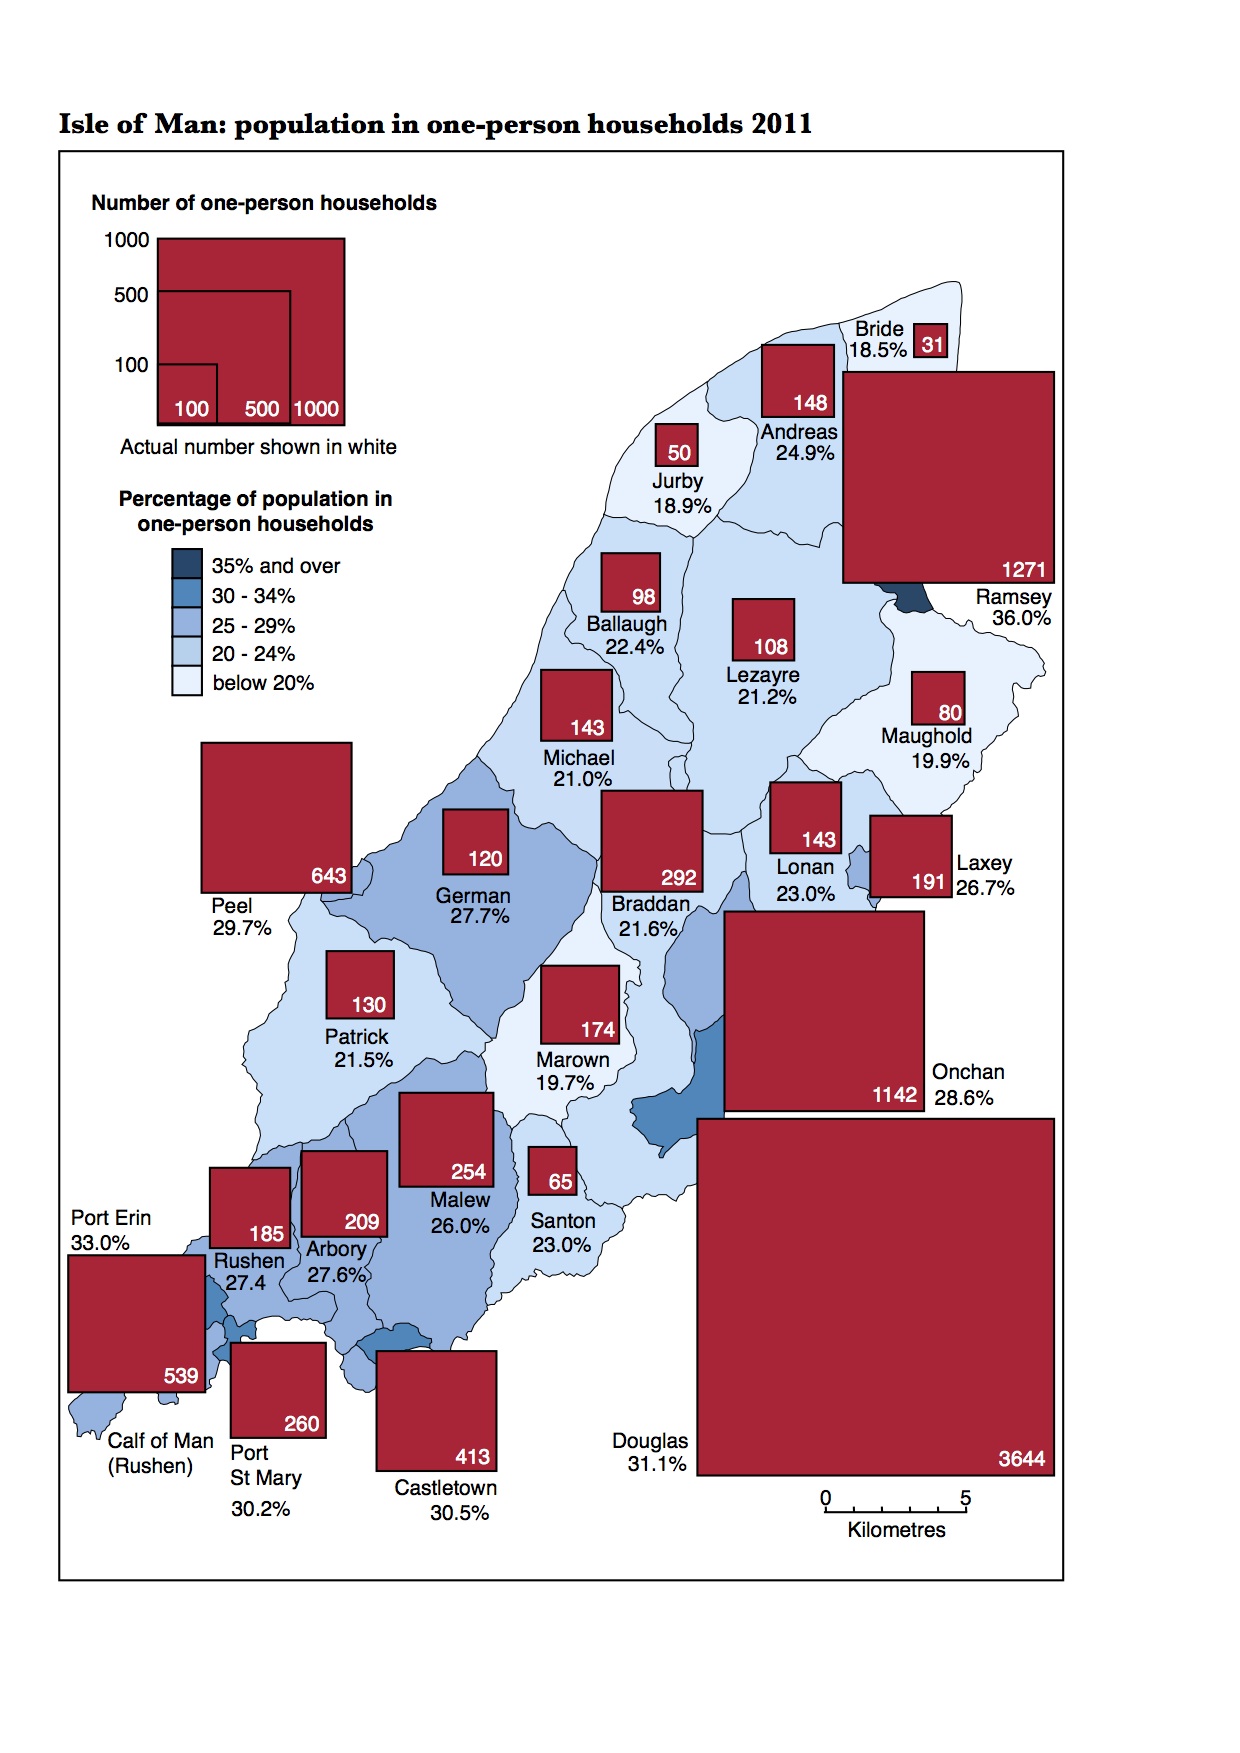
In 2011, the number of one-person households was 10,333, an increase of 15.6% on the 2001 figure. This increase is consistent with an ageing population and a large widowed population in the older age groups. The proportional squares map below shows the number of one-person households in each census district whilst the choropleth map shows the percentage of houses occupied by one person. Ramsey, Port Erin, Douglas, Castletown and Port St Mary all have more than 30% of their households containing one person.
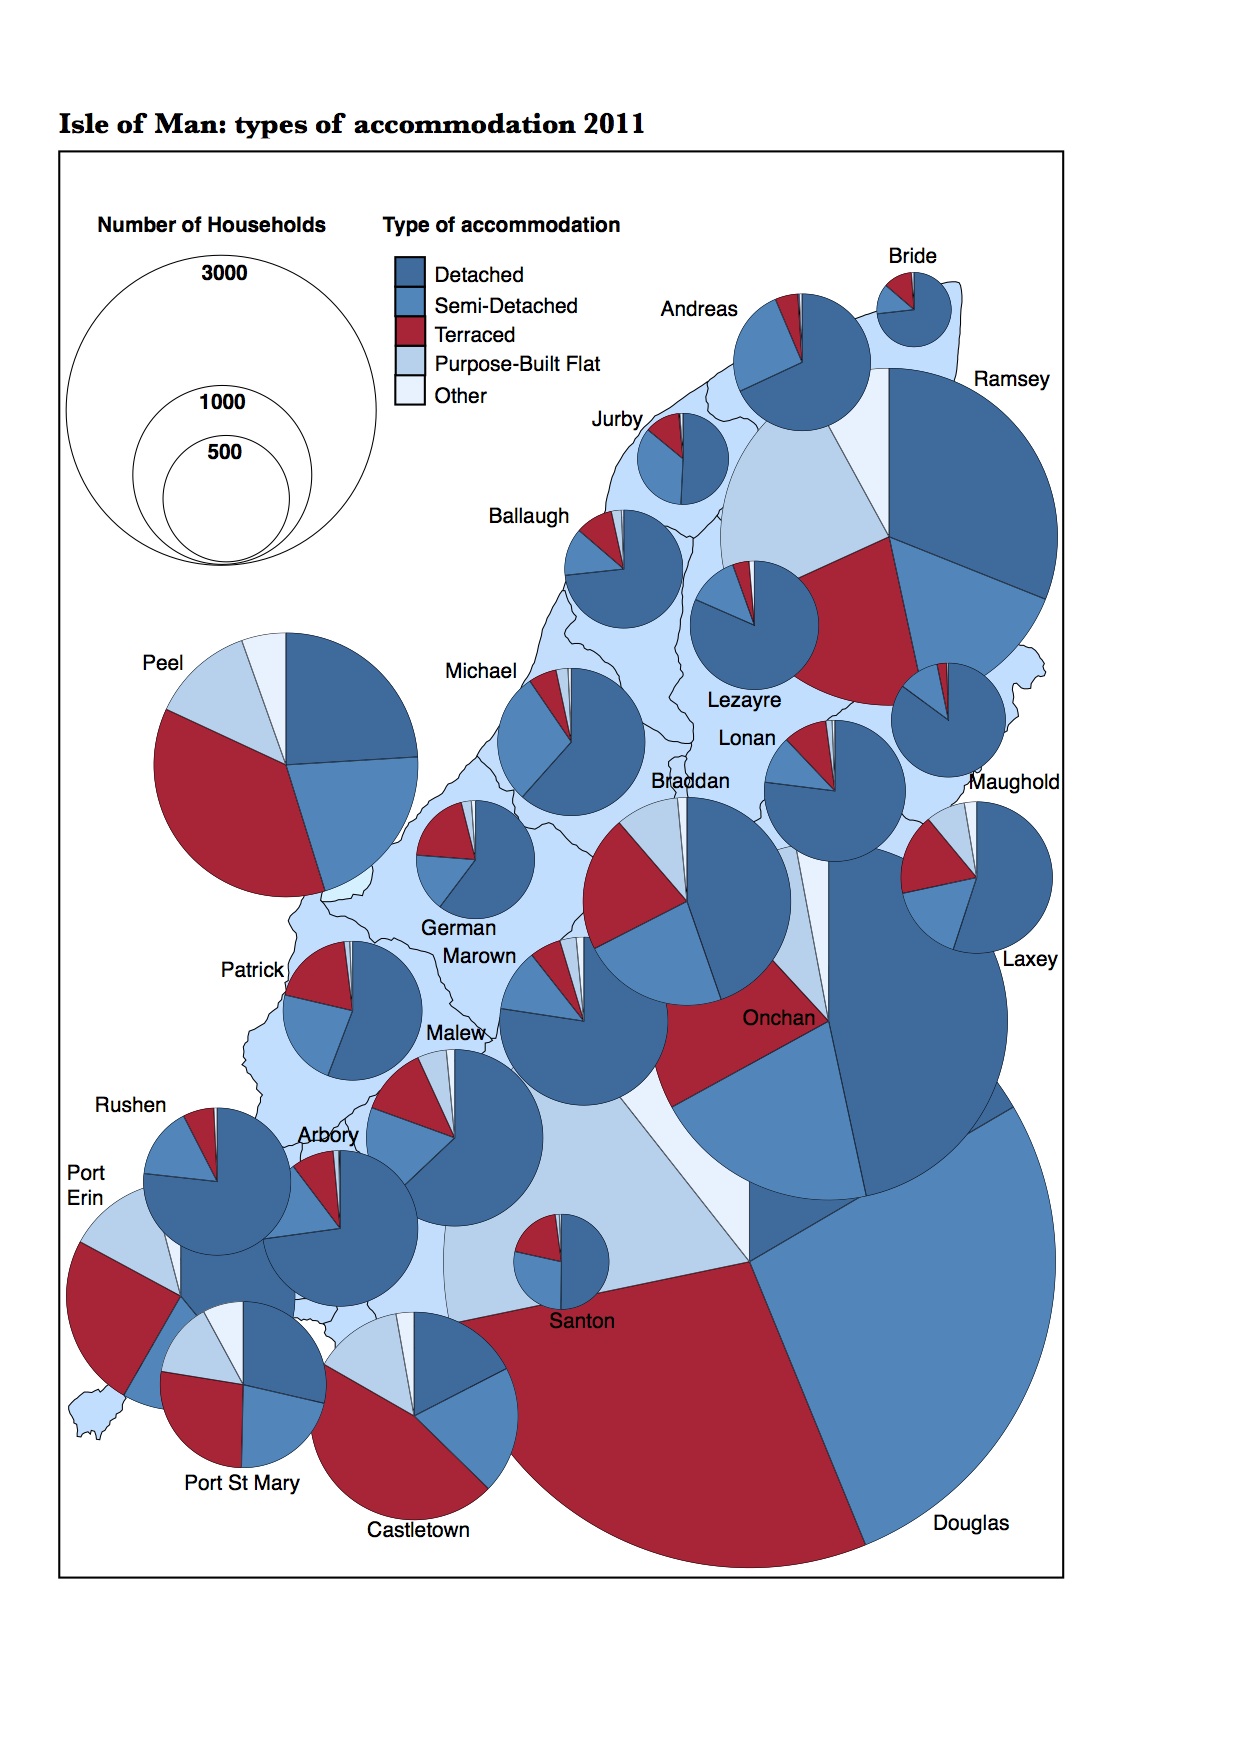
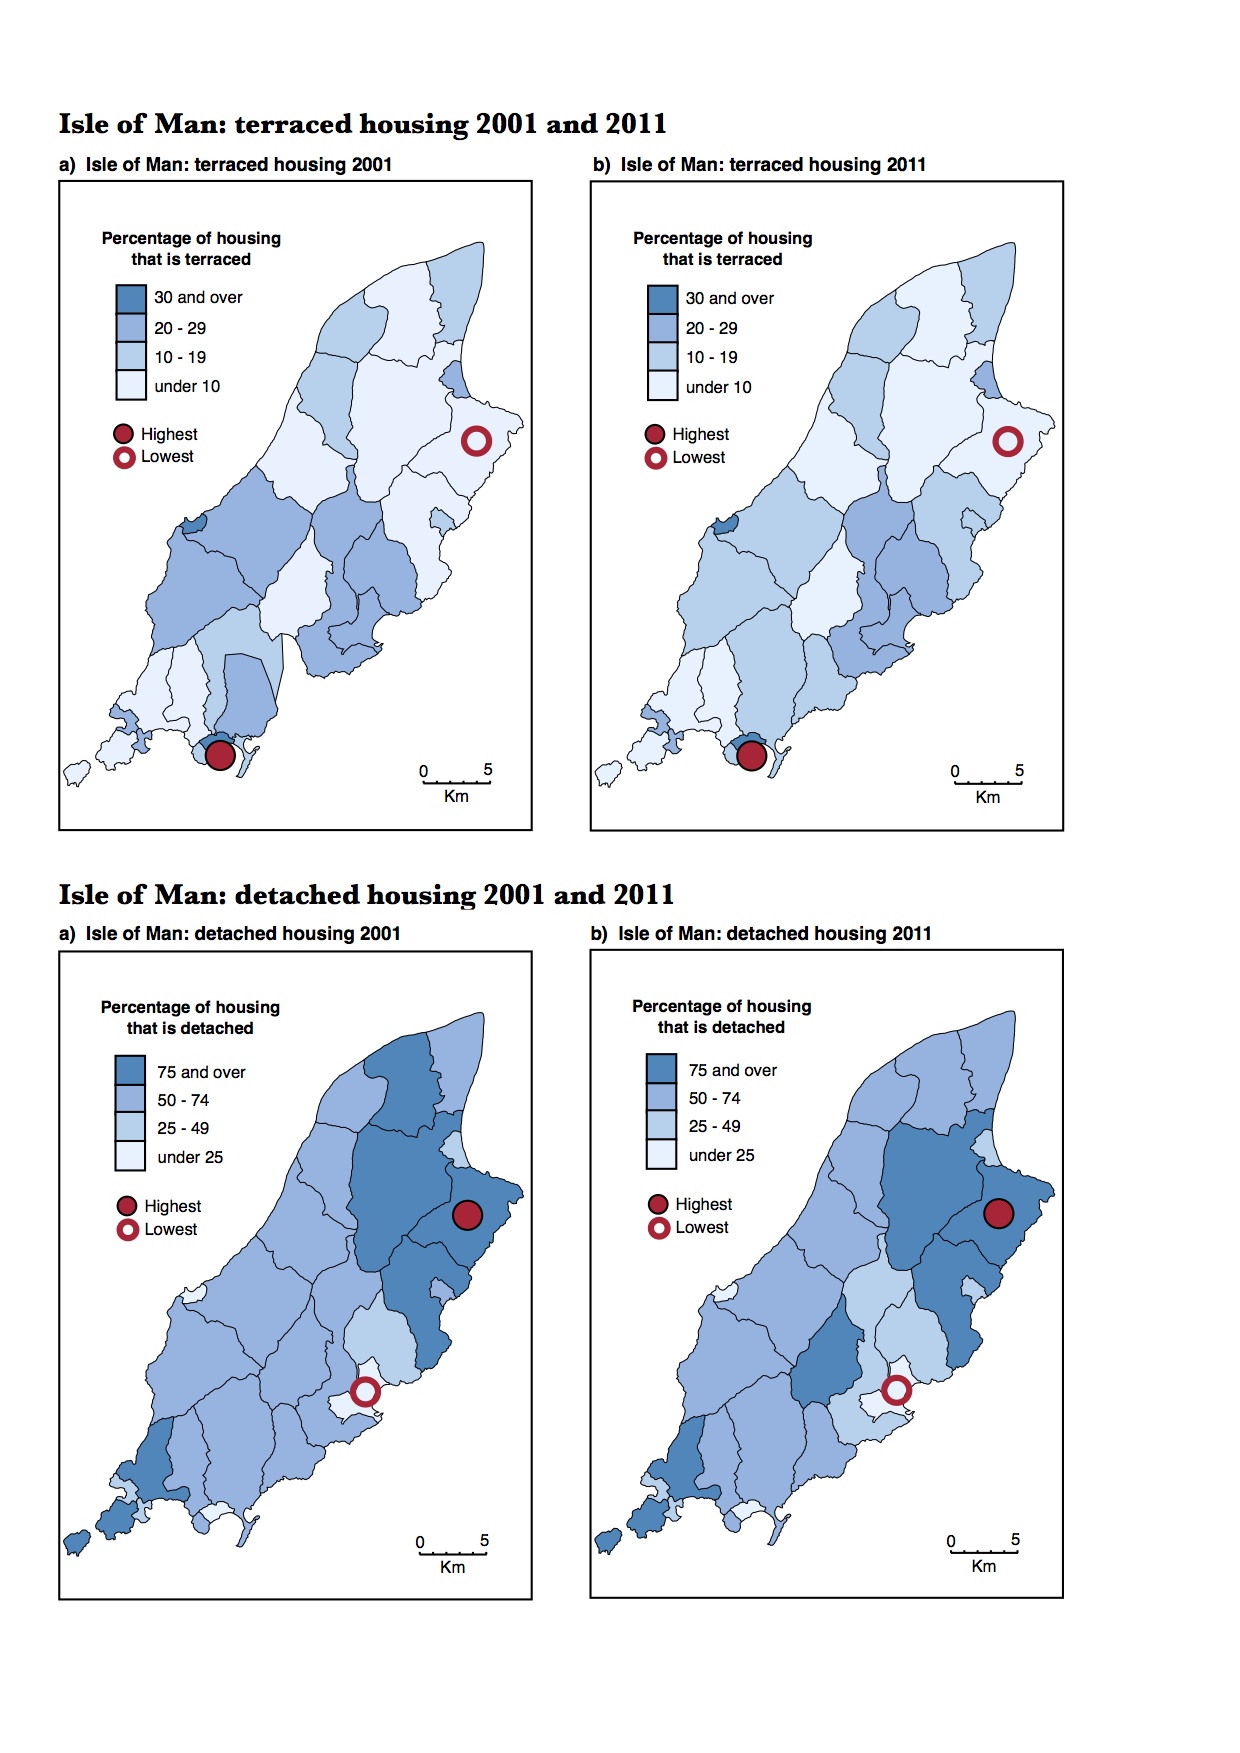
In the years leading up to 2011 there was considerable change is the housing stock of the Isle of Man. By 2011 terraced and detached housing together accounted fore more than 60% of all housing units.
Terraced houses grew in number between 2001 and 2011 by over 560 but as a proportion of all accommodation fell from 24.1% to 22.9%. Castletown and Peel were the census districts with the highest proportions of terraced housing (46% and 37% respectively) in 2011. Maughold had less than 3% terraced housing.
Detached housing added another 1,060 units over the same period but the percentage of housing that was detached fell from 38.7% to 37.3%. In all parish local authorities except Braddan, detached housing accounted for more than 50% of all housing whereas in all towns and villages except Laxey, detached housing represented less than half of all houses.
Semi-detached houses increased in both number and percentage of all housing between 2001 and 2011 adding 940 houses and rising to 21.7% of the total.
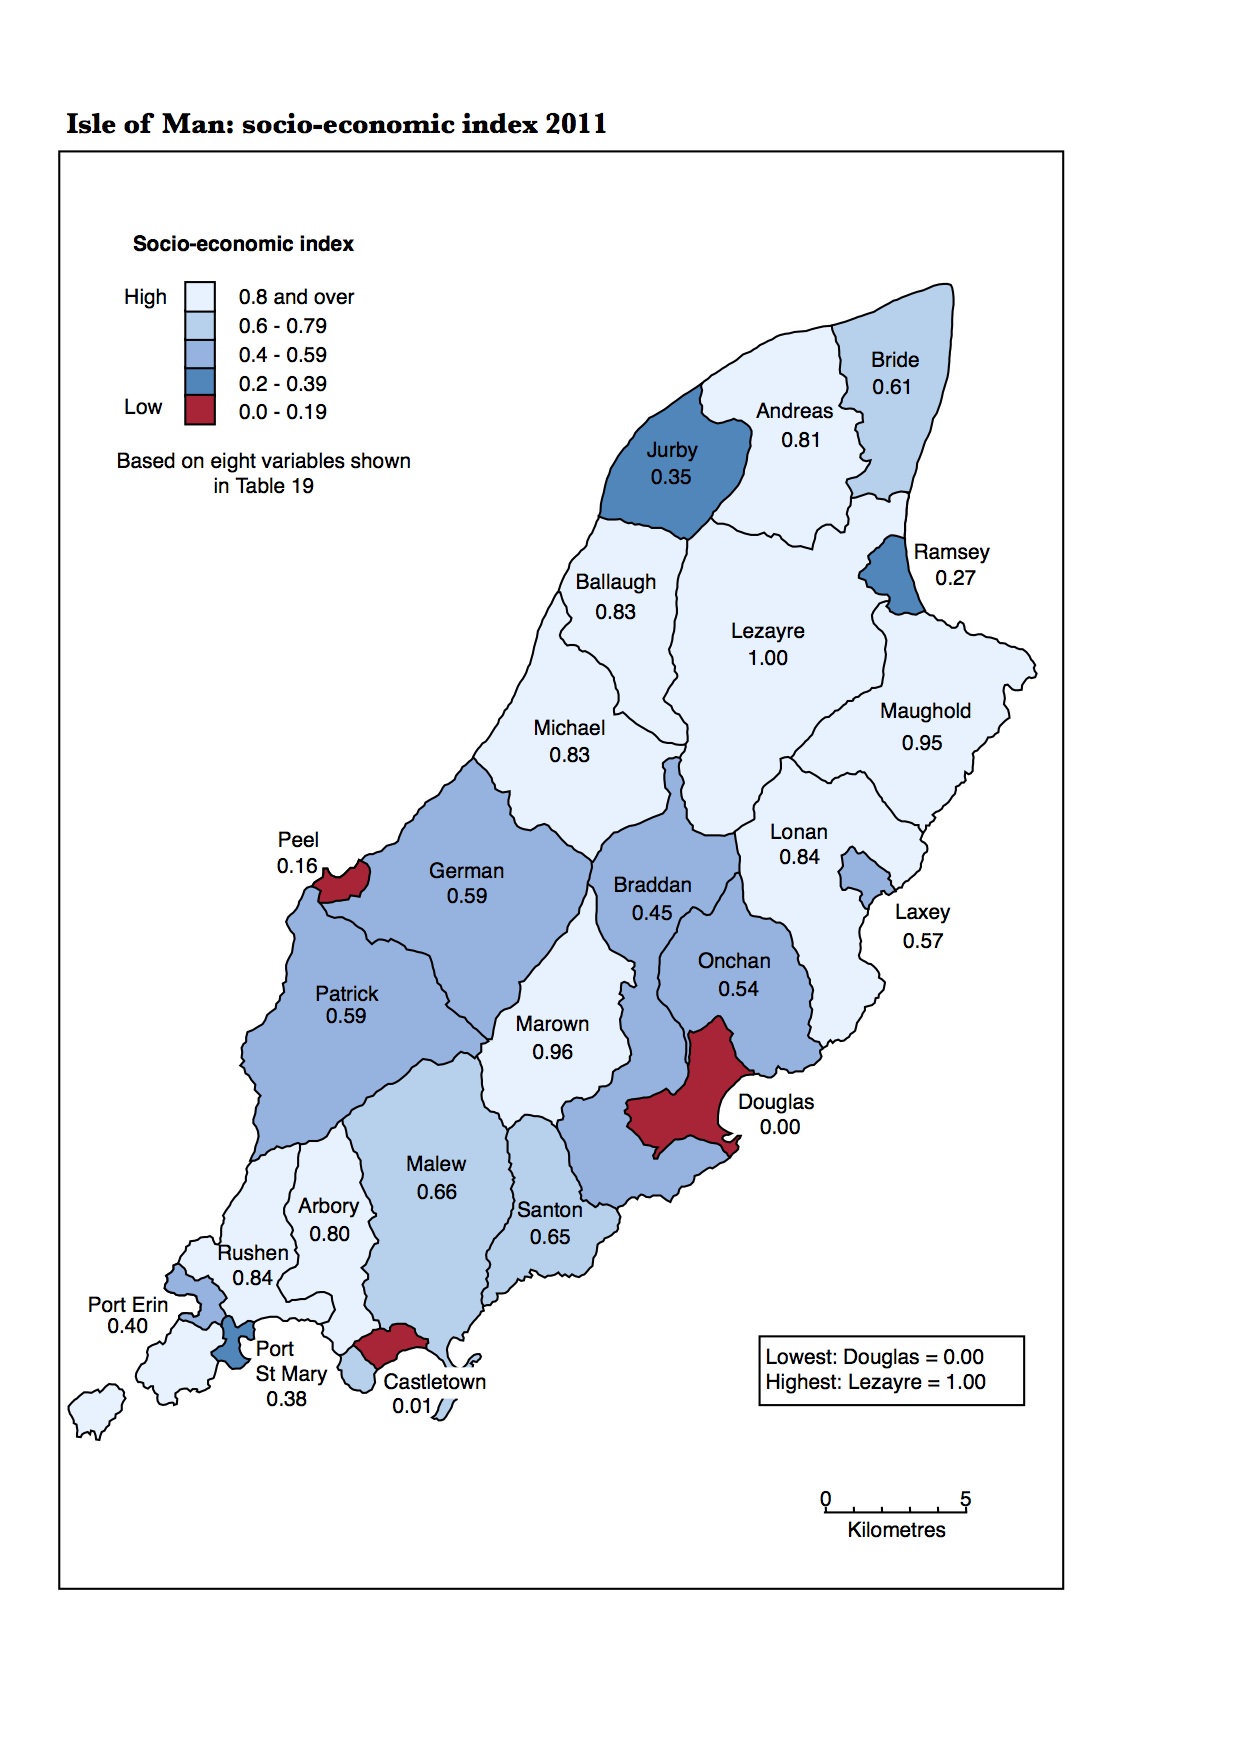
The largest change in accommodation type in the Isle of Man between 2001 and 2011 was the increase in the number of apartments and flats.