The 2016 Census Report recorded the first drop in the population of the Isle of Man since 1986. It may not have come as a complete surprise, but it still came as a shock.
The economy of the Isle of Man is in its 4th decade of continuous economic growth, having not experienced recession since 1983/84. Since the middle of the twentieth century, it has been taken for granted that economic growth and population growth go hand in hand. Periods of population decline in the 1950s and the early 1980s tracked periods of economic decline. Conversely, the years of economic growth were mirrored by a growing population. Winterbottom (2000 p.274 in A New History of the Isle of Man Vol 5) observed that the population is '… always a good indicator of the performance of the economy'.
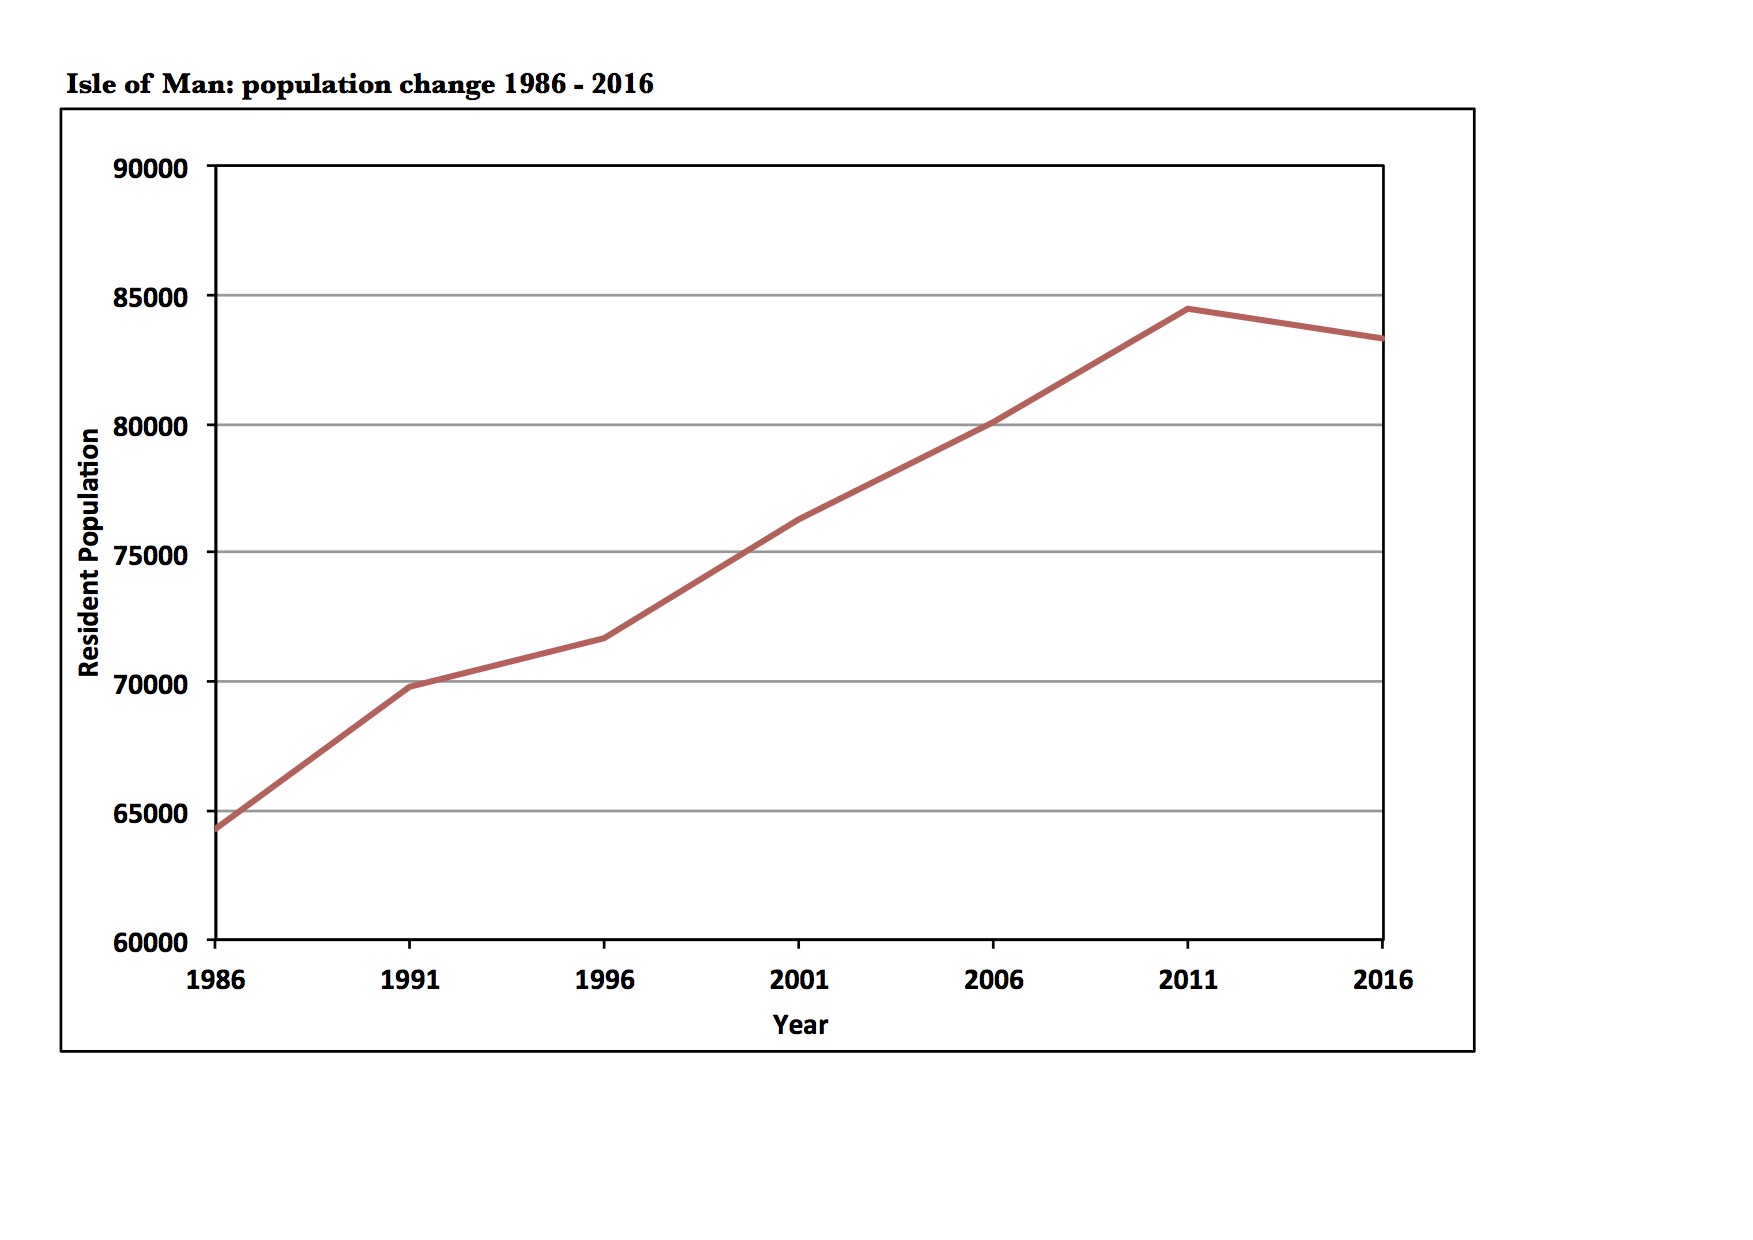
Over the 25 years between 1986 and 2011 both economic growth and population growth continued unabated. By 2011 the Isle of Man had almost 84,500 residents, an increase of over 20,000 from 1986.
In the years between the 2011 and 2016 censuses, the Island's GNP continued to grow in real terms. In some years the growth was over 5% higher than inflation. Such growth might have been expected to be visible in new employment opportunities, population growth and growing government revenue. Instead, despite such strong and sustained economic growth, the Island's population stopped growing and declined.
Part 3 of my census analysis will explore this population decline – it will also outline the losses that the Isle of Man faced in addition to reduced numbers.
Overall population loss of 1.4%
The 2016 Census recorded population decline. In April 2016 year the Isle of Man had 1,183 fewer residents than five years earlier, a decline of 1.40%. The first graph below shows the very clear change in direction in the Island’s population growth.
4.9% loss of population aged under 65 years
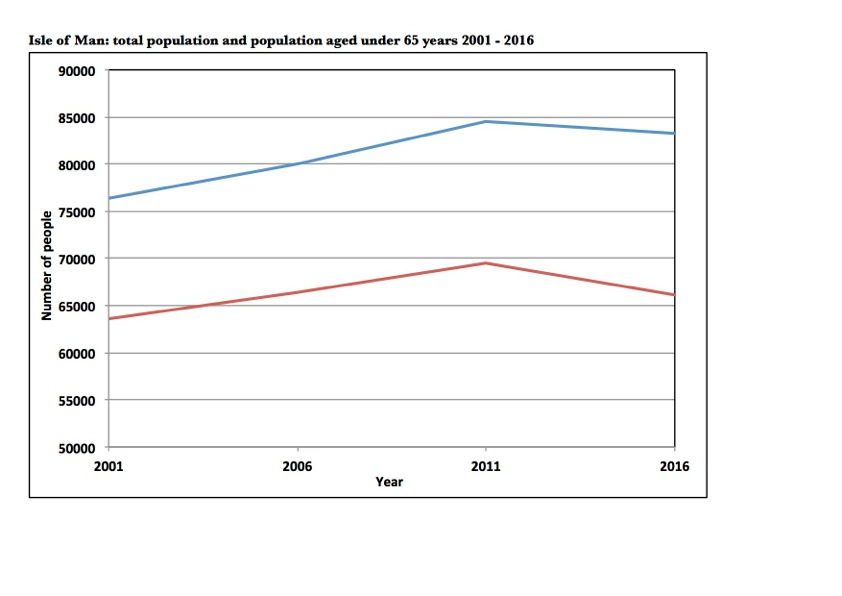
The population losses recorded in 2016 were not evenly spread across the age-sex profile of the Isle of Man. The losses were much higher in the under 65 years age groups than in the population as a whole. The second graph shows a very sharp fall in the under 65 years population after 2011 amounting to a decline of over 3,400 (4.89%). In contrast, the number of people aged over 65 years increased by 2,219 (14.81%). The previous blog in this series (Part 2 – population ageing) provided further information about the Island’s changing age-sex profile.
Overall, the percentage of the population aged under 65 years fell from 82.3% to 79.3%. The median age of the Island’s population (the age at which half of the population is older and half younger) increased by 2.3 years to 44.8 years.
Since the publication of the Census, the second quarter COMIN Economic report has offered some evidence of population growth since 2016 through population estimates based on the number of people registered with a GP. However, the recorded increase in the number of under 65 year olds registered with a doctor since the end of March 2016 was just 98 up to the end of June 2017. The Island has lost a damaging number of people in the under 65 age group.
Loss of 3.4% of the population of Douglas.
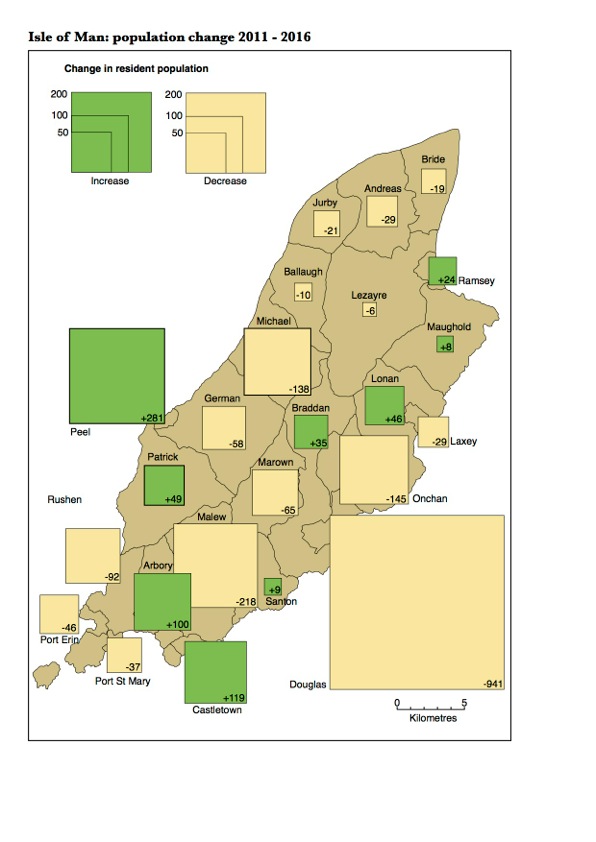
The population losses between 2011 and 2016 were very unevenly spread across the Island. The overall population loss of 1,183 (1.4%) across the Island was heavily concentrated in Douglas where the population fell by 941 or 3.37%.
The map below shows the numerical changes in the population across the Island’s 24 census districts. Douglas showed the largest increase followed by Malew, Onchan and Michael. The areas of largest growth were Peel, Castletown and Arbory.
The median age in Douglas rose from 38.3 years in 2011 to 40.7 years in 2016.
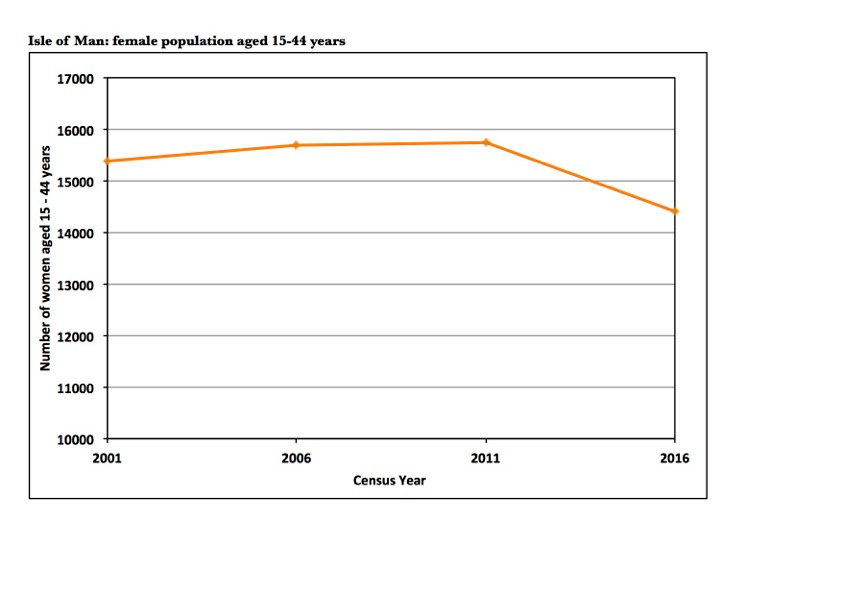
Loss of 8.6% of the women of child-bearing age
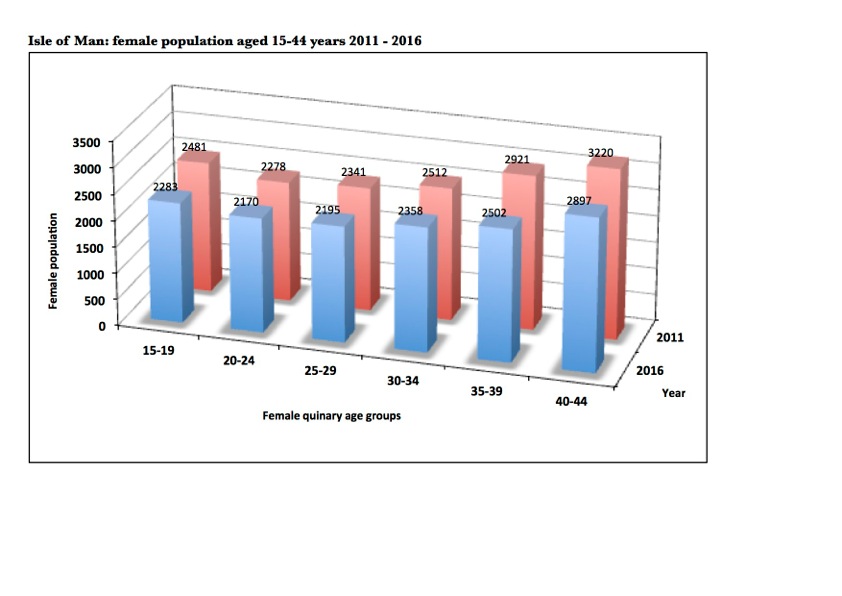
Part 1 of my 2016 Census analysis looked at the impact of the fall in the number of births in the Isle of Man: between 2010 and 2016 births fell by 26%. One of the causes of the decline in births is the decline in the number of women of child-bearing age, usually taken as 15 – 44 years. In 2011 there were over 15,750 women residents aged between 15 and 44. By 2016 this had fallen to just over 14,400 – a decline of almost 1,350 or 8.6% in five years.
The first of the two graphs below shows that in 2016 the number of women in each five-year age group between 15 and 44 (blue bars) was lower than in 2011 (red bars).The second graph shows that the 2016 total of 14,400 was below both the 2006 and 2001 figures of 15,690 and 15,400 respectively. The number of women of child-bearing age is at a twenty-year low.
Whatever other trends are contributing to the reduction in the number of births, this reduction in the number of potential mothers makes it less likely that the number of births will quickly recover to the level of more than 1,000 recorded in 2009 and 2010.
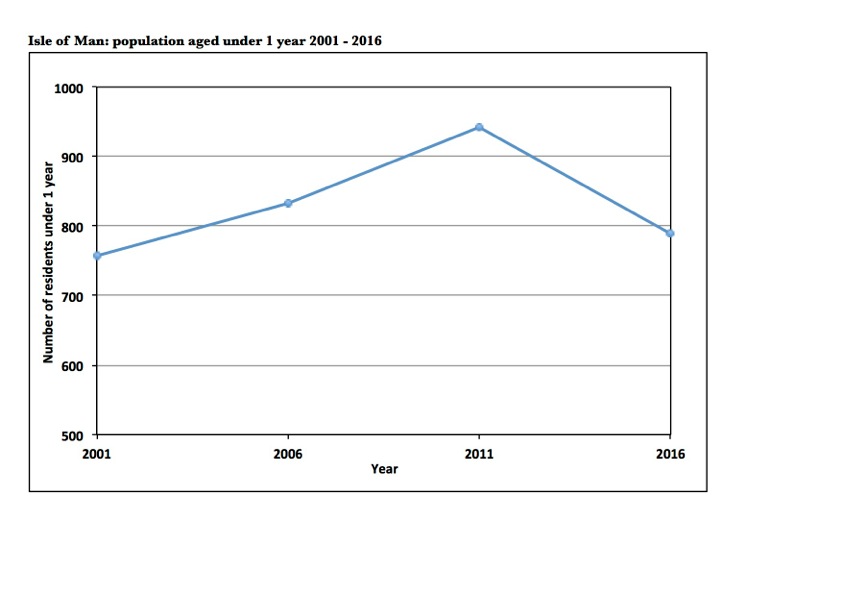
Loss of 16% of the Island's 0-1 year olds
By 2011 the number of under 1 year olds living in theIsle of Man had climbed to over 940. This represented an increase of 24.4% on the figure of 757 recorded in 2001. Between 2011 and 2016 the number of under-1s fell to 789, a decline of 16.2% in just five years. The under-5s fell by 11.2% over the same period.
A drop in the number of very young children is unlikely to be the direct result of net emigration of this age group. The primary cause has been the fall in the number of births (a 26% drop between 2010 and 2016). But it has been the emigration of women of childbearing age that has contributed to the reduction in births.
Reversal of net immigration
For more than 50 years, immigration into the Isle of Man has been greater than emigration. The next graph shows the balance of the population equation. Births and immigration add to the population, deaths and emigration take away. In the 10 years up to 2011 immigration (yellow) exceeded emigration (blue). The decline in immigration is not just something that started in 2011. The 2011 Census recorded almost 1,450 (15.0%) fewer immigrants to the Island than in 2006. By 2016 immigration had fallen to 43.1% of the 2006 figure.
In the 10 years up to 2011, immigration exceeded emigration giving net immigration – a balance of inward migration. The 2016 Census recorded a different picture, net emigration – more people leaving to live elsewhere than arriving to live here. The graph shows an excess of emigration over immigration amounting to almost 1,360.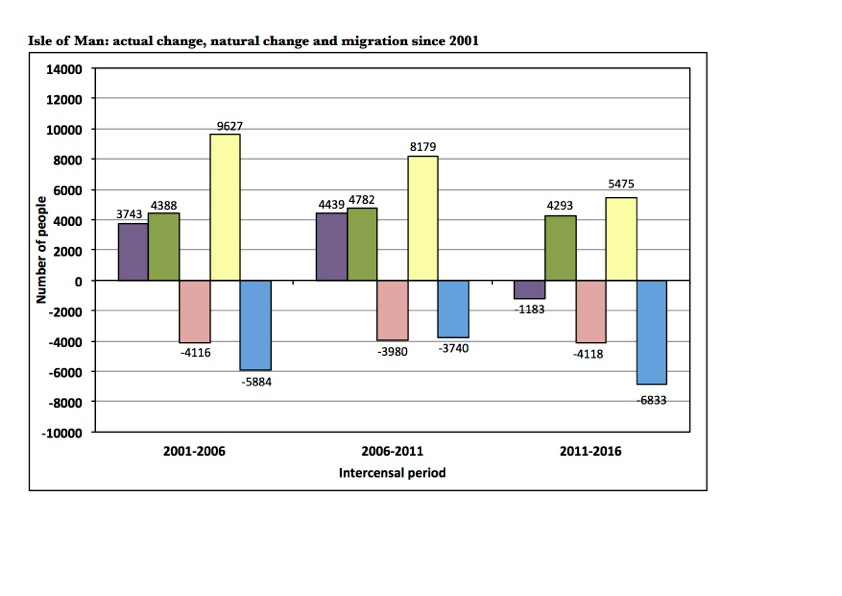
Loss of 13% of the 20-24 age group
The increased emigration between 2011 and 2016 shown in the graph above was not shared across all age groups. The graph below attempts to show the balance of immigration and emigration. The immigration figures are those recorded in the 2016 census but the census is unable to collect information on emigration, therefore the emigration figures are arrived at using data UK data on the estimated number of deaths for each age group (age of death data is not available in the Isle of Man). The most remarkable part of the graph is the scale of emigration (shown in red) in the 20-29 age groups of 2016.
As the 15-19 year olds of 2011 grew into the 20-24 year olds of 2016, they reduced in number by over 680 (13.4%). The cohort above them, the 25-29 year olds of 2016, fell by almost 400 (8.3%). The 2016 Census recorded immigration between the censuses of 261 20-24 year olds. Emigration in this age group must have reached around 940. A remarkable 18.4% of the 15-19 year olds of 2011 were no longer resident on the Isle of Man five years later. These reductions are not accounted for by young people going to university as students continue to count as Isle of Man residents.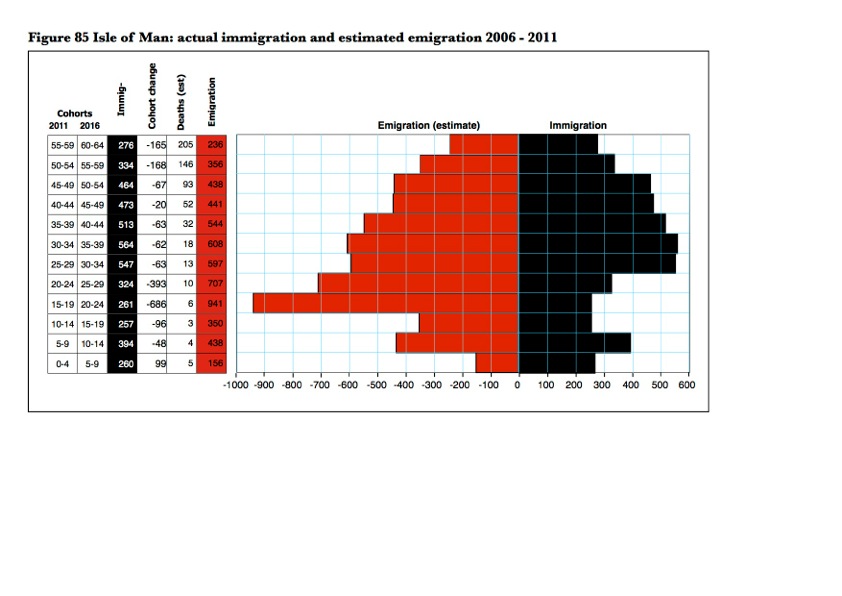
Taking steps to reduce population losses
The population losses experienced by the Isle of Man call out for action to be taken. We need population growth to help restore the balance of the population, secure the vibrancy that younger people bring to any community and to contribute to the workforce and the economy. Such growth needs to be at a sustainable level with appropriate checks and balances in place. The IOM Social Attitudes Survey 2017 showed a greater acceptance of population increase on the Island (38% in favour compared with 27% in 2016) but the majority of people would still prefer the Island’s population to remain the same (49%) or decrease (13%).
Over the last five years annual economic growth has averaged more than 3% above inflation. But this growth in the economy has not prevented population decline. Neither has economic growth resulted in an increase in Government Income, which has fallen in real terms. It is vital that any policy of population (and economic) growth is well thought-out with clear objectives and evidence-based policies. The front page of a recent newspaper urged readers: 'Help to attract more people here to boost the Manx economy'. Perhaps it would be a more appropriate aim to help the economy grow to benefit the population and provide income for Government to maintain services, health care, infrastructure, pensions and nursery provision.